Exploit Prediction Scoring System (EPSS) scoring coming to ServiceNow Vulnerability Response?
- Mark as New
- Bookmark
- Subscribe
- Mute
- Subscribe to RSS Feed
- Permalink
- Report Inappropriate Content
09-20-2022 03:40 PM
Hey team! Any chance that ServiceNow is looking to integrate the Exploit Prediction Scoring System (EPSS) scoring into ServiceNow to enhance vulnerability data?
https://www.first.org/epss/
What is EPSS?
EPSS provides a fundamentally new capability for efficient, data-driven vulnerability management. It is an open, data-driven effort that uses current threat information from CVE and real-world exploit data. The EPSS model produces a probability score between 0 and 1 (0 and 100%), where the higher the score, the greater the probability that a vulnerability will be exploited.
Using EPSS for Better Vulnerability Management
EPSS is estimating the probability of exploitation activity, which is just one of many considerations in a risk-based approach to vulnerability management. Because of that, EPSS should never be treated as a risk score. Other factors, such as how accessible vulnerable assets are to attackers, the type of weakness the vulnerability presents, the asset's purpose and value, etc., may all be factors to consider when prioritizing which vulnerabilities should be addressed.
In regard to the (overly simplistic) risk formula, Risk = Threat x Vulnerability x Impact, EPSS relates only to the threat compoment. Asset owners should consider many other aspects of the vulnerability, their network, the asset, and so on before making a final decision to remediate or delay remediation. However, a lower EPSS score should represent a lower threat score (EPSS is never zero), and thus if everything else is held constant a lower overall risk. Risk analysis is obviously a complicated topic. EPSS is only offering an improved measurement on one aspect of the overall picture, and should therefore be treated as such.
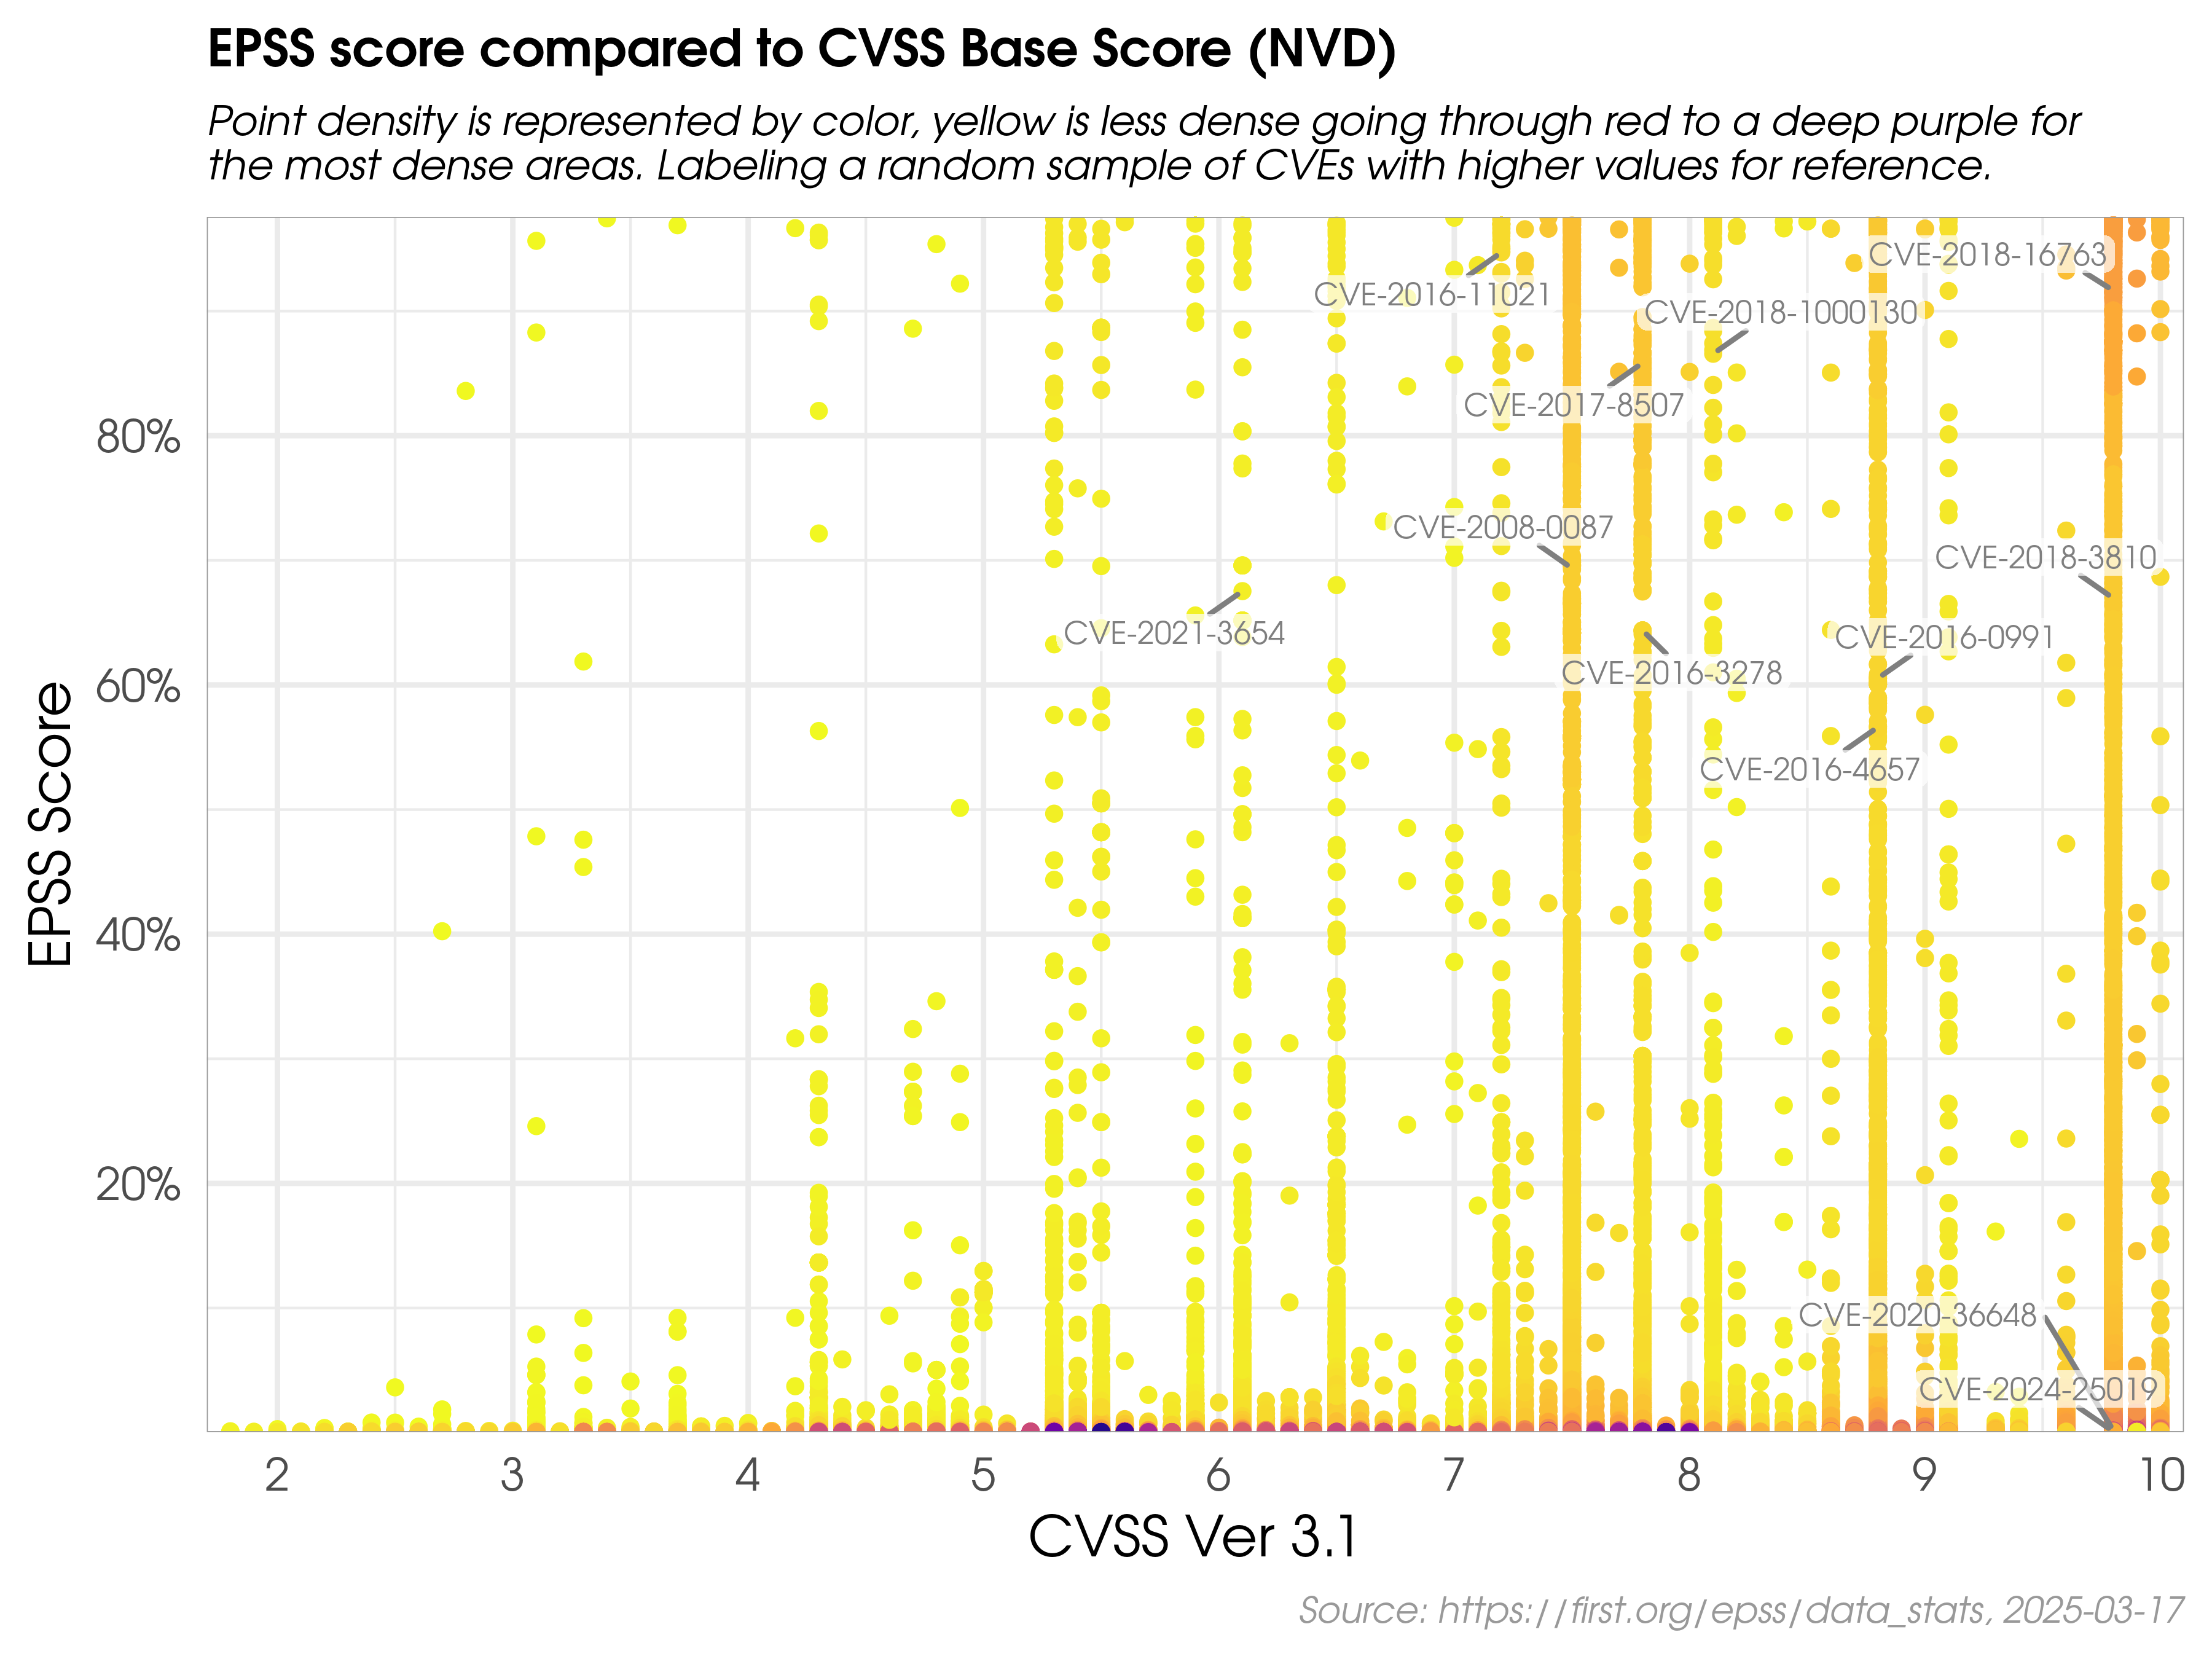
Using EPSS and CVSS Together
The figure below shows the correlation between EPSS and CVSS scores based on data from 05-16-2021. Recall that EPSS produces prediction scores between 0 and 1 (0 and 100%) where higher scores suggest higher probability of exploit. Each dot represents one or more vulnerabilities (CVEs). Some vulnerabilities are labeled for illustrative purposes.
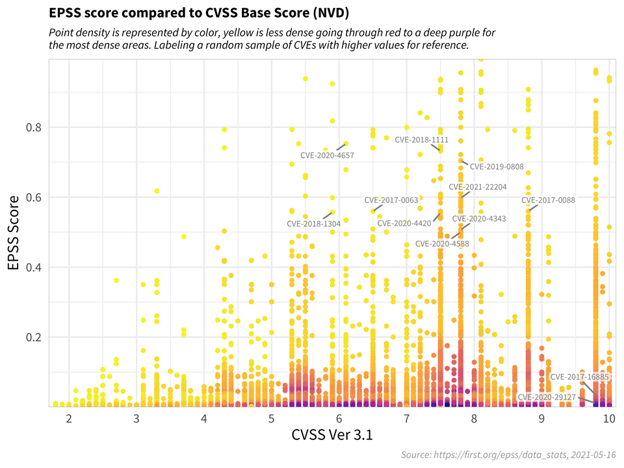
First, observe how most vulnerabilities are concentrated near the bottom of the plot, and only a small percent of vulnerabilities have EPSS scores above 50% (0.5). While there is some correlation between EPSS and CVSS scores, overall, this plot provides suggestive evidence that attackers are not only targeting vulnerabilities that produce the greatest impact, or are necessarily easier to exploit (such as for example, an unauthenticated remote code execution).
This is an important finding because it refutes a common assumption that attackers are only looking for — and using — the most severe vulnerabilities. And so, how then can a network defender choose among these vulnerabilities when deciding what to patch first?
CVSS is a useful tool for capturing the fundamental properties of a vulnerability, but it needs to be used in combination with data-driven threat information, like EPSS, in order to better prioritize vulnerability remediation efforts.
For the sake of discussion, consider the diagram below, which has been annotated to generally illustrate vulnerability priortitization.
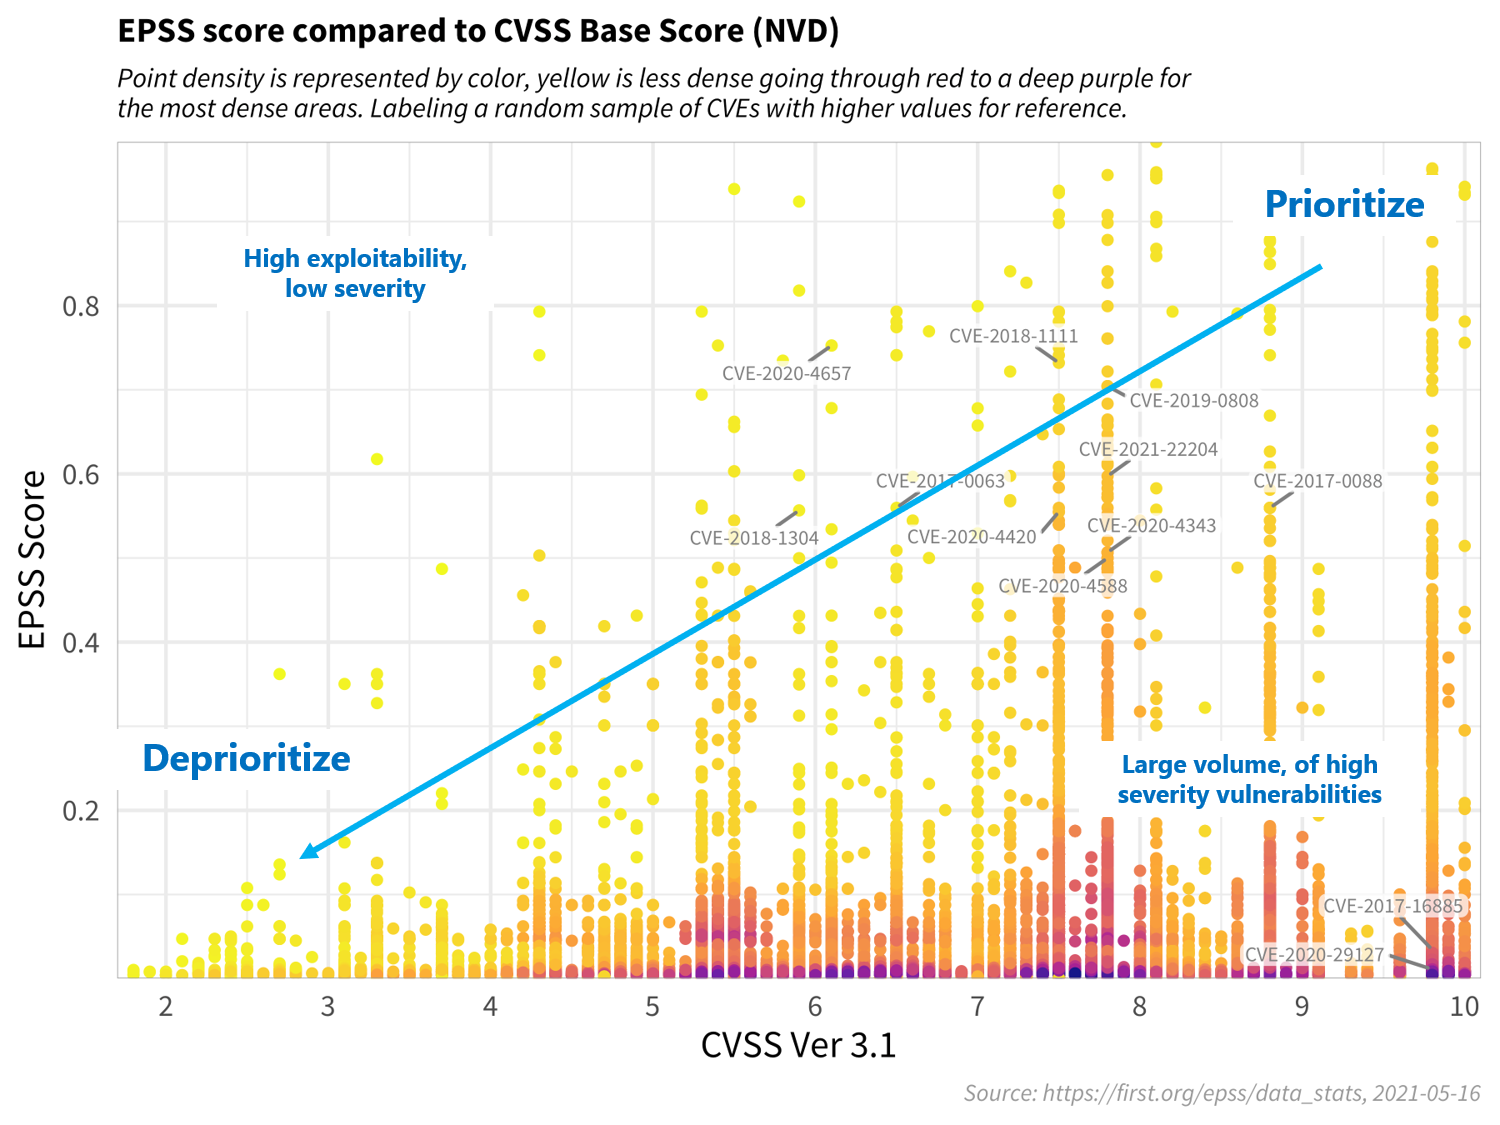
Vulnerabilities in the bottom left represent those that have both a lower probability of being exploited, and would incur a lower severity impact to the information system, and can therefore be deprioritized. Similarly, vulnerabilities in the upper left quadrant may be more likely to be exploited, but, on their own, would not critically impact the information system. (Further research, however, should be conducted in order to better understand how these sorts of vulnerabilities may be used in a chained attack.)
Vulnerabilities in the bottom right represent those that, while may severely impact the information system, are much less likely to be exploited, relative to others, but should still be watched in the event that the threat landscape changes.
Vulnerabilities in the upper right quadrant, on the other hand, are the most critical kinds of vulnerabilities which are both more likely to be exploited, and could fully compromise the information system, and should therefore be patched first.
This decision strategy as described above emphasizes the tremendous capability of EPSS. A network defender who has typically had to address thousands or tens of thousands of exposed vulnerabilities, is now able to spend fewer resources, to patch more vulnerabilities that are much more likely to be exploited. This capability to differentiate among vulnerabilities has never before been possible.
What Else Can EPSS Do?
EPSS has additional benefits for other stakeholders, especially for national policy.
1: Smarter National Vulnerability Management Policies
First, in 2019 the US Department of Homeland Security (DHS) issues a Binding Operational Directive (19-02, https://cyber.dhs.gov/bod/19-02/) to all federal agencies describing how they must patch Critical vulnerabilities (i.e. those with CVSS scores of 10) within 15 days of detection, and High Severity vulnerabilities (those with CVSS scores above 7.0) within 30 days of detection. As illustrated in the discussion above, this could reasonably encompass thousands of vulnerabilities, most of which will never be exploited, and would therefore waste valuable federal resources. Instead, it becomes clear that any national remediation strategy should instead consider both the severity of a vulnerability, and the exploitability when issuing directions to federal agencies (or any network defender).
2: EPSS for National Security Threat Assessments
Second, EPSS has national security benefits, as well. The US Government maintains a small, but controversial process concerning the use of zero-day vulnerabilities. The Vulnerability Equities Process (VEP, https://trumpwhitehouse.archives.gov/sites/whitehouse.gov/files/images/External%20-%20Unclassified%2...) for deciding how to use zero day vulnerabilities. As explained in the VEP Charter, the tension at play is whether the zero-day vulnerability should be used for National Security purposes, or disclosed to the vendor (and public) for patching.
National Security arguments (by offensive equity partners) can be quite compelling. However, objectively assessing and presenting a defensive equity posture can be quite difficult because of the lack of available information about the number and types of vulnerable systems across the Nation. But now, with EPSS, there is an objective and repeatable way for a Federal Agency like DHS to combine an EPSS score with information about national-level vulnerabilities, in order to capture the specific threat posed by one of these vulnerabilities. Again, we believe this is a powerful capability that has never before available.
3: EPSS Can Scale, to Produce System, Network, and Enterprise-level Exploit Predictions
EPSS predicts the probability (threat) of a specific vulnerability being exploited, but it can also be scaled to estimate the threat for multiple vulnerabilities on a server, a subnet, mobile device, or at an enterprise level. This capability is possible because of a statistical property about the independence of events, and requires simply computing the probability of at least one event occurring.
For example, consider an organization with 100 vulnerabilities, each with a 5% chance of being exploited. The question of great interest to a network defender might be: what is the probability that at least one of those vulnerabilities will be exploited, and therefore what is my overall threat?
The probability of at least one event occurring is simply the complement (opposite) of no events occurring, that is:
P(at least one exploited vulnerability) = 1 - P(no vulnerabilities are exploited).
Where, the probability of no vulnerabilities is the linear product of each vulnerability not being exploited. In our case, since each vulnerability has a 5% chance of being exploited, they each have a 95% chance of not being exploited. And since there are 100 of them, we can write this as:
P(at least one vuln exploited) = 1 - P(no vulns are exploited) = 1 - P(one vuln not exploited)^100 = 1 - 0.95^100 = 0.994
Which says that the probability of at least one of the vulnerabilities being exploited is 99.4%.
Further, once this has been calculated, it becomes a potentially useful metric to gauge and compare one’s information security posture over time, i.e. by simply comparing this value over time, or across devices, or organizations.
Examining Actual Exploit Data
The figure below shows actual exploit observations for a sample of vulnerabilities. Each row represents a separate vulnerability (CVE), while each blue line represents an observed exploit. The red dots represent the time of public disclosure of the CVE. (Note that we are not tracking whether these exploits are successful or not.)
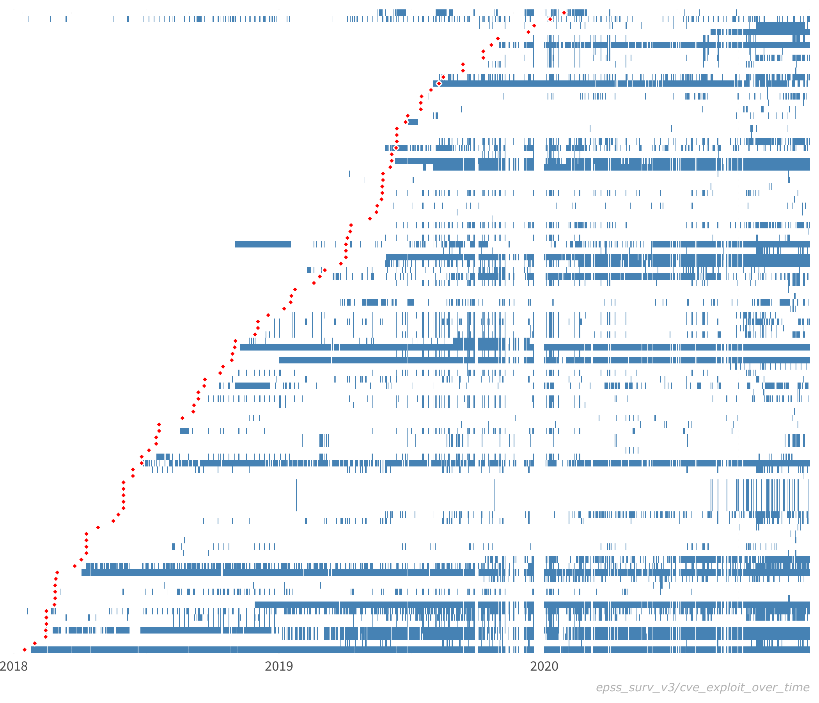
While it is difficult to draw conclusive insights from these behaviors, we can comment on general characteristics. First, simply viewing these data is interesting because they provide a novel view into real-world exploit behavior. Indeed, it is exceedingly rare to see these kinds of data publicly available, and we are fortunate to be able to share them with you. It is also thought-provoking to examine and consider the different kinds of exploit patterns:
- Duration: Some vulnerabilities are exploited over a short period of time (days, weeks), while others are exploited over much longer periods of time (years). For example, some vulnerabilities in this sample have been exploited for nearly the full time window of 3 years.
- Density (intensity, prevalence): Some vulnerabilities are exploited many times during their overall duration, while others are only exploited a few times. For example, notice how exploits for some vulnerabilities occur repeatedly throughout the lifespan of the exploit, while for other vulnerabilities, there are long periods of inactivity. In addition, some vulnerabilities seem to be exploited nearly continuously (one at the bottom) and therefore appear as almost a solid blue line.
- Fragmentation: In addition to the number of times a vulnerability is exploited within its duration (i.e. density), we may also be interested in the fragmentation of exploit behavior. That is, the measure of consistent exploitation day after day, versus exploitation followed by periods of inactivity.
- Time to first exploit (delay): From the data we collect, some vulnerabilities are exploited almost immediately upon public disclosure, while for other vulnerabilities, there is a much longer delay until first observed exploit. And indeed, this figure shows a number of vulnerabilities that are exploited before public disclosure. (Given the many factors involved in CVE disclosures, we make no comment on whether or not these are proper zero day vulnerabilities.) For example, some vulnerabilities in this sample are exploited immediately, while others take 6 months or more to be exploited.
- Co-exploitation: Some vulnerabilities appear to be exploited at the same time as others. This kind of co-exploitation may be suggestive of vulnerability chaining, the practice of using multiple, successive exploits in order to compromise a target.
Mission
The Exploit Prediction Scoring System (EPSS) is an open, data-driven effort for estimating the likelihood (probability) that a software vulnerability will be exploited in the wild. Our goal is to assist network defenders to better prioritize vulnerability remediation efforts. While other industry standards have been useful for capturing innate characteristics of a vulnerability and provide measures of severity, they are limited in their ability to assess threat. EPSS fills that gap because it uses current threat information from CVE and real-world exploit data. The EPSS model produces a probability score between 0 and 1 (0 and 100%). The higher the score, the greater the probability that a vulnerability will be exploited.
If you would like to join the EPSS special interest group, email us at epss-chairs@first.org. Anyone is welcome to join our mailing list and Slack. We meet every other Friday at 11 am eastern time, GMT -5.
Alternatively, if you would like to receive email updates about EPSS news and announcements, please subscribe to our low-volume EPSS-news list:
- Subscribe by writing an e-mail to epss-news-subscribe [at] first.org
- Unsubscribe by writing an e-mail to epss-news-unsubscribe [at] first.org
Important Update to EPSS
The latest update to the EPSS model was released on February 4th, 2022.
Goals & Deliverables
We currently produce EPSS scores for all CVEs in a published state. In addition, the EPSS SIG is working to improve the maturity of data collection and analysis in order to provide near-real time assessments of all publicly disclosed vulnerabilities. This requires developing partnerships with data providers and establishing an infrastructure from which we can provide a publicly-accessible interface for EPSS scores. We are already ingesting multiple open and commercial datasets, and our most critical data are those that can identify instances of actual vulnerability exploitation (i.e. exploits in the wild), which can come from many sources: intrusion detection systems, honeypots, network observatories, malware analysis and detection efforts, and other sensor networks.
If you know of any potential data that could improve this effort, please let us know! We can be reached at epss-chairs@first.org.
Usage Agreement
EPSS is an emerging standard developed by a volunteer group of researchers, practitioners, academics and government personnel. We grant the use of EPSS scores freely to the public, subject to the conditions below. We reserve the right to update the model and these webpages periodically, as necessary, though we will make every attempt to provide sufficient notice to users in the event of material changes. While membership in the EPSS SIG is not required to use or implement EPSS, however, we ask that if you are using EPSS, that you provide appropriate attribution where possible. EPSS can be cited either from this website (e.g. "See EPSS at https://www.first.org/epss), or as: Jay Jacobs, Sasha Romanosky, Benjamin Edwards, Michael Roytman, Idris Adjerid, (2021), Exploit Prediction Scoring System, Digital Threats Research and Practice, 2(3)
The EPSS Model
Motivation
Vulnerability remediation has some fundamental truths. First, there are too many vulnerabilities to fix them all immediately. Past research has shown that firms are able to fix between 5% and 20% of known vulnerabilities per month. Secondly, only a small subset (2%-7% of published vulnerabilities are ever seen to be exploited in the wild. These truths set up both the need and the justification for good prioritization techniques since firms both cannot and do not need to fix everything immediately.
Therefore, what is the optimal prioritization strategy when remediating vulnerabilities? Unfortunately, there is no one single answer to that question, but instead lies with a collection of metrics to help inform and guide the prioritization decisions, which is where this research comes in.
The Exploit Prediction Scoring System (EPSS) is a community-driven effort to combine descriptive information about vulnerabilities (CVEs) with evidence of actual exploitation in-the-wild. By collecting and analyzing these data, EPSS seeks to improve vulnerability prioritization by estimating the likelihood that a vulnerability will be exploited. The EPSS model produces a probability score between 0 and 1 (0% and 100%). The higher the score, the greater the probability that a vulnerability will be exploited (in the next 30 days).
Data Architecture and Sources
EPSS was first developed in the summer of 2019 and initially presented at BlackHat that same year. Since then, a Special Interest Group (SIG) has been working hard at FIRST to build a scalable computing infrastructure to ingest and process multiple data sources. In fact, through community partnerships and the work of EPSS SIG members, EPSS is currently collecting multiple different data sources, most of them daily including but not limited to the following list:
- MITRE’s CVE List - Only CVEs in the “published” state are scored
- Text-based “Tags” derived from the CVE description and other sources talking about the vulnerability
- Count of how many days the CVE has been published
- Count of how many references are listed in the CVE
- Published Exploit code in any of: Metasploit, ExploitDB and/or Github
- Security Scanners: Jaeles, Intrigue, Nuclei, sn1per
- CVSS v3 vectors in the base score (not the score or any subscores) as published in the National Vulnerability Database (NVD)
- CPE (vendor) information as published in NVD
- Ground Truth: Daily observations of exploitation-in-the-wild activity from AlienVault and Fortinet.
The current EPSS model (v2022.01.01) was trained with 1,164 variables, most of which were boolean values representing the presence of a specific attribute (i.e. was Microsoft the vendor? Does this CVE have an exploit included in the metasploit framework?). Details about the full model development of earlier models are available in our research papers (see links below). The current model was trained with Gradient Boosting, specifically poisson rate with exposure.
Model Performance
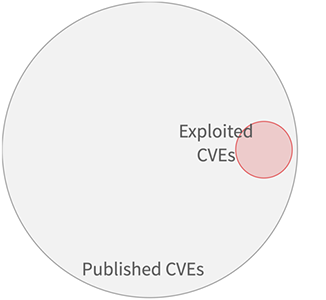
To discuss model performance, let’s begin with a simple strategy of remediating all CVEs with a CVSS base score of 7 and above. In order to measure the quality of this approach, we need an outcome measure. In this case, we get the outcome measure by tracking vulnerabilities being exploited in the wild. This gives each vulnerability two different attributes: would we choose to remediate it or not, and was this observed as exploited or not? These two attributes enable us to put each vulnerability remediation decision into one of four categories, as shown in the figure below. The large gray circle represents all published CVEs, and all of the CVEs that were scored with 7 or higher with CVSS are shown in blue. And finally all of the CVEs that we observed as being exploited are shown in red.
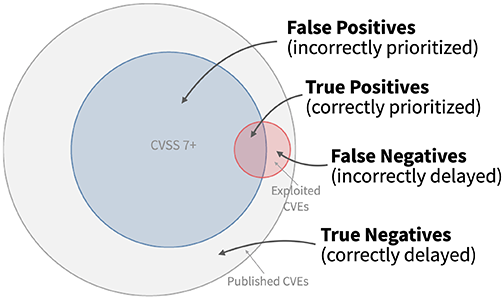
- True positives (TP) are the good decisions – the prioritized vulnerabilities that were exploited in the wild. This is where the blue circle of remediated vulnerabilities overlaps with the exploited vulnerabilities in red.
- False positives (FP) are vulnerabilities that were prioritized, but not exploited. These decisions represent potentially wasted resources and are in the blue circle of remediated vulnerabilities that did not overlap with the red circle of exploited vulnerabilities.
- False negatives (FN) are vulnerabilities that were not prioritized (and not remediated) but were observed to be exploited in the wild. These are the vulnerabilities in the red circle not being overlapped by the remediated vulnerabilities in the blue circle.
- True Negatives (TN) are vulnerabilities not prioritized and not exploited, these are the vulnerabilities in the outer gray circle that were neither remediated nor exploited in the wild.
As the figure above shows, the strategy to remediate based on CVSS 7+ produces many false positives (the blue part not overlapping the red) and still leaves about half of the exploited vulnerabilities open and waiting to be remediated (the red not overlapped by the blue).
Efficiency and Coverage
Using these four categories (TP, FP, FN, TN) we can derive two more meaningful metrics, what we’ve termed as efficiency and coverage (or what information theory calls precision and recall respectively).
Efficiency considers how efficiently resources were spent by measuring the percent of remediated vulnerabilities that were exploited. In the above diagram, efficiency is the amount of the blue circle covered by the red circle. Remediating mostly exploited vulnerabilities would be a high efficiency rating (resources were allocated efficiently), while remediating perhaps random or mostly non-exploited vulnerabilities would result in a low efficiency rating. Efficiency is calculated as the number of exploited vulnerabilities prioritized (TP) divided by the total number of prioritized vulnerabilities (TP+FP).
Coverage is the percent of exploited vulnerabilities that were remediated, and is calculated as the number of exploited vulnerabilities prioritized (TP) divided by the total number of exploited vulnerabilities (TP + FN). In the above diagram, coverage is the amount of the red circle covered by the blue circle. Having low coverage indicates that not many of the exploited vulnerabilities were remediated with the given strategy.
Measuring and understanding both efficiency and coverage allows different firms to approach vulnerability remediation differently based on their risk tolerance and resource constraints. Firms that do not have many resources may wish to emphasize efficiency over coverage, attempting to get the best impact from the limited resources available. But for firms where resources are less constrained and security is critical for success, the emphasis can be on getting high coverage of the highest risk vulnerabilities.
Efficiency and Coverage in the real world
Let us compare how different remediation strategies would perform in the real world. We first collected the following information about each vulnerability on November 1st, 2021: the CVSS V3 base score, EPSS Version 1 score, and the newest version of EPSS (referred to as V2 here). We then recorded which vulnerabilities were exploited over the next 30 days in order to examine how each scoring system would perform. In order to make these comparable, we started with a CVSS threshold of 8.8 and above and attempted to match the same level of coverage (about 50%) in the two EPSS strategies (using v1 and v2).
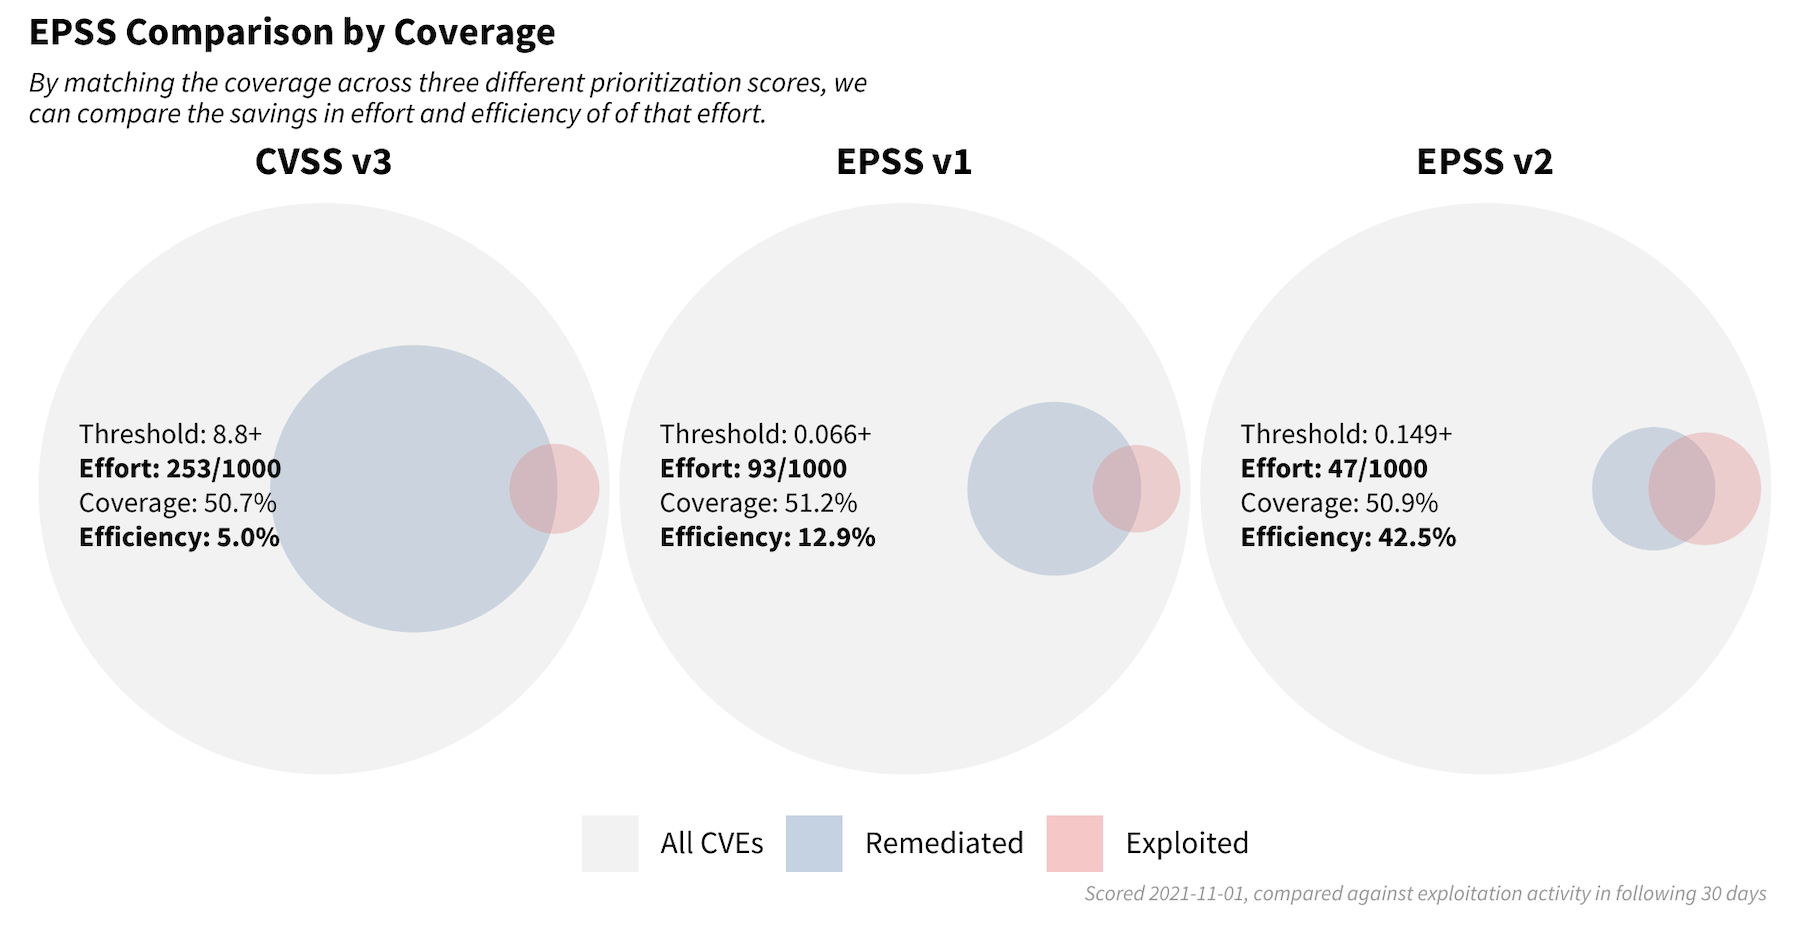
With a remediation strategy based exclusively on CVSS v3.1 and a threshold set for scores at 8.8 or higher, 253 vulnerabilities out of every 1,000 vulnerabilities would be flagged for remediation. Out of those flagged, 5% had observed exploitation activity, and of those exploited, this strategy covered about 50.7% of those.
With a strategy of EPSS v1 (developed in early 2019) and a threshold set for scores at 0.066 or higher, 93 out of every 1,000 vulnerabilities would be flagged for remediation. Out of those flagged, 12.9% had observed exploitation activity and a comparable 51.2% coverage was observed.
With a strategy of the newly released EPSS scores and a threshold set for scores 0.149 or higher, 47 out of every 1,000 vulnerabilities would be flagged for remediation. Out of those flagged, we have a large jump in efficiency up to 42.9% which maintains roughly the same amount of coverage at 50.9%.
This exercise demonstrates the enterprise resource savings obtainable by adopting EPSS as a prioritization strategy. Using EPSS v2 requires organizations to patch fewer than 20% (47/253) of the vulnerabilities they would have mitigated, compared to using strategy based on CVSS.
Maintaining Capacity
With the previous example, we tried to maintain the same level of coverage and allowed the level of effort (our remediation capacity) to shift along with the efficiency achieved. But what if we compared the different strategies and maintained the same level of effort (capacity) and just simply replaced the strategy we were employing to identify which vulnerabilities we should flag for remediation?
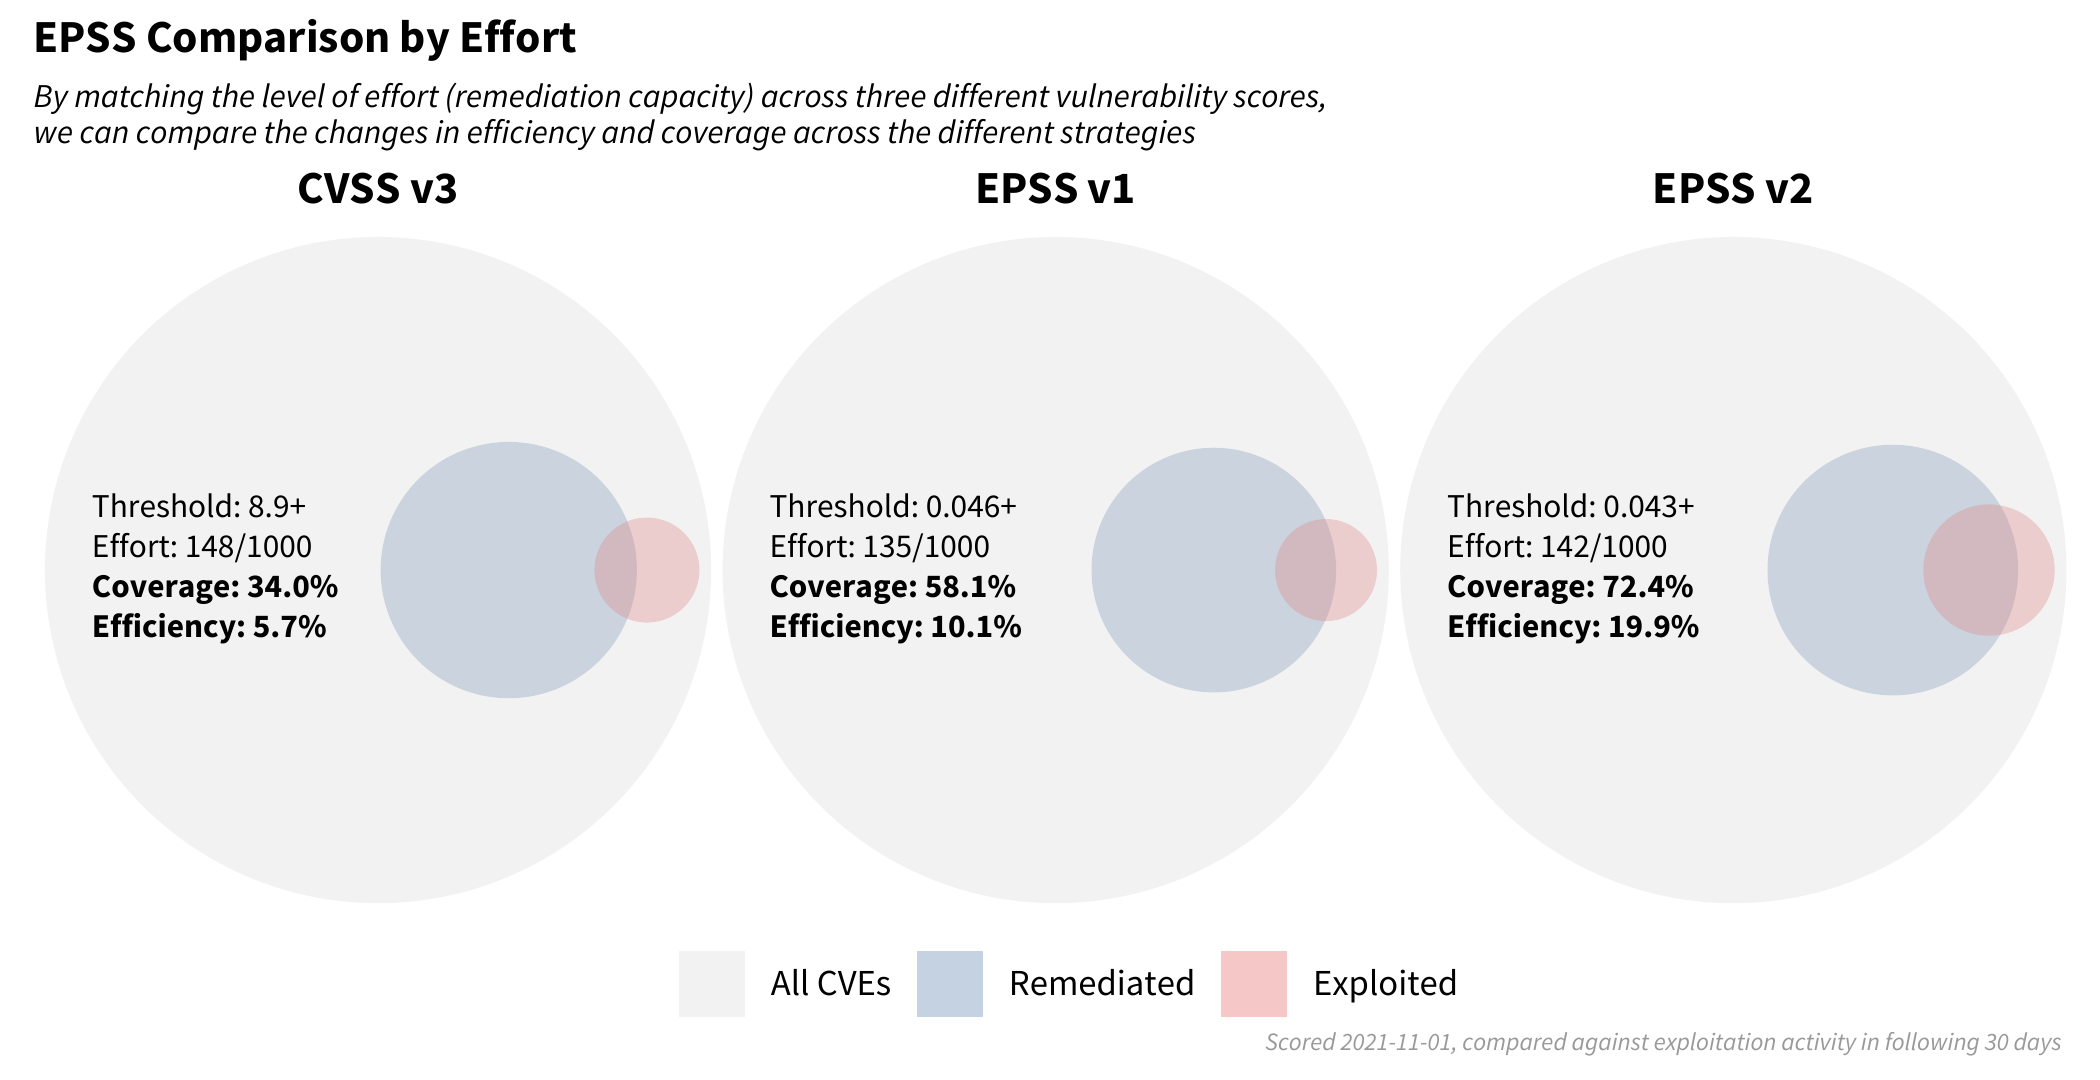
Recent research finds that the median capacity across hundreds of organizations was 15.5% so we targeted a strategy matching this finding of addressing about 150 out of every 1,000 vulnerabilities.
Note how the blue circles are approximately the same size across each of the three strategies (the set of scored CVEs were not the same across each strategy, so the red and blue circles vary slightly). However the level of efficiency and coverage are not the same. Moving from left to right in the strategies (CVSS v3, EPSS v1 to EPSS v2) we are improving in both the efficiency of remediation and the coverage of the exploited vulnerabilities. This can be summed up in the following plot:
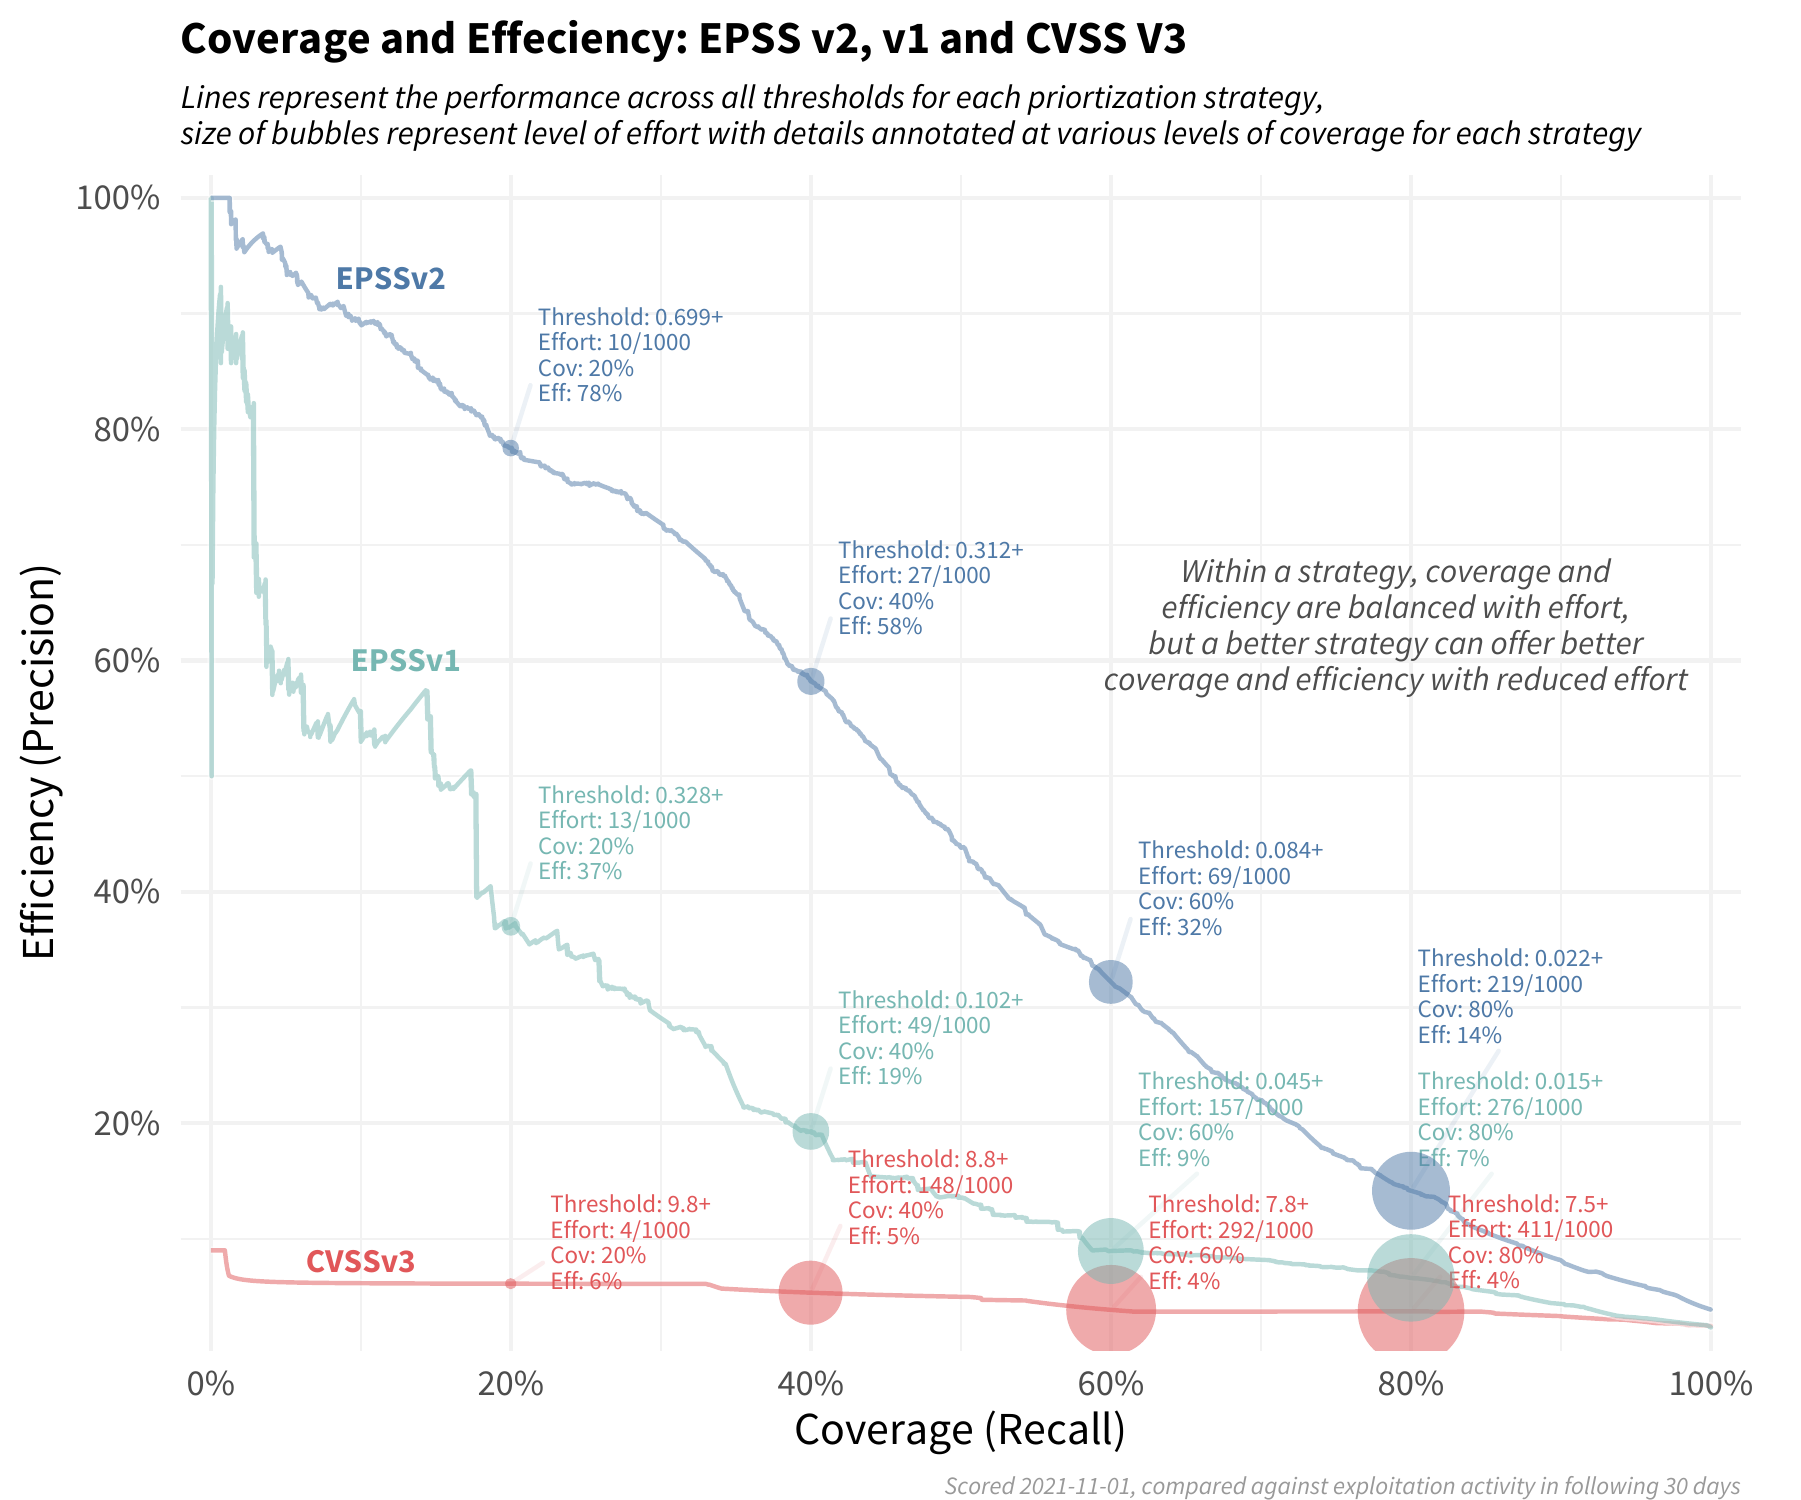
The red line across the bottom reflects a remediation strategy using CVSS v3.1 base score. Note the relatively constant level of efficiency, and in order to improve coverage we have to remediate more and more vulnerabilities at the same level of efficiency.
The green-blue middle line illustrates a strategy using EPSS v1, which achieves a higher level of efficiency and coverage than CVSS alone, though the performance has degraded since it was first developed.
The upper blue line represents the latest EPSS model. Smaller organizations can achieve remarkable efficiency with limited resources, and organizations that have more resources can achieve both better efficiency and coverage than either of the other two strategies.
Typically there is a tradeoff between coverage and efficiency, but by shifting a prioritization strategy to reference the latest EPSS scores, organizations can see a marked improvement over other existing methods available to them.
Model Interpretation
Interpreting a gradient boosted model has some challenges since it builds in interaction effects (for example, the impact of a remote code execution vulnerability may depend on whether it's in desktop software versus networking equipment). This causes the weights and contributions of variables to shift around from one vulnerability to the next, so specific contributions are difficult to extract and communicate. But there are techniques that we can leverage to give us an indication of why the outcomes are what they are.
We turn to SHAP values, which stands for SHapley Additive exPlanations, which was developed to understand the contributions of variables inside the model. As a quick means of introducing the concept, each observation (CVE) is analyzed and marginal contributions are calculated for each input variable. The challenge, as mentioned, is that the contributions of each variable can shift from one CVE to the next.
The figure below shows the top variables sorted by their contribution. Anyone who’s been around vulnerabilities shouldn’t be surprised at what tops this list. Having exploit code published and easily available for a remote code execution vulnerability with no privilege required on a Microsoft product would probably see exploitation activity. BUT that interpretation falls into a pitfall with this type of view. Just because something ranks high in this chart does not necessarily mean it positively contributes to exploitation activity. It may be that the contribution is negative for a variable but still contributes and has an effect on the score.
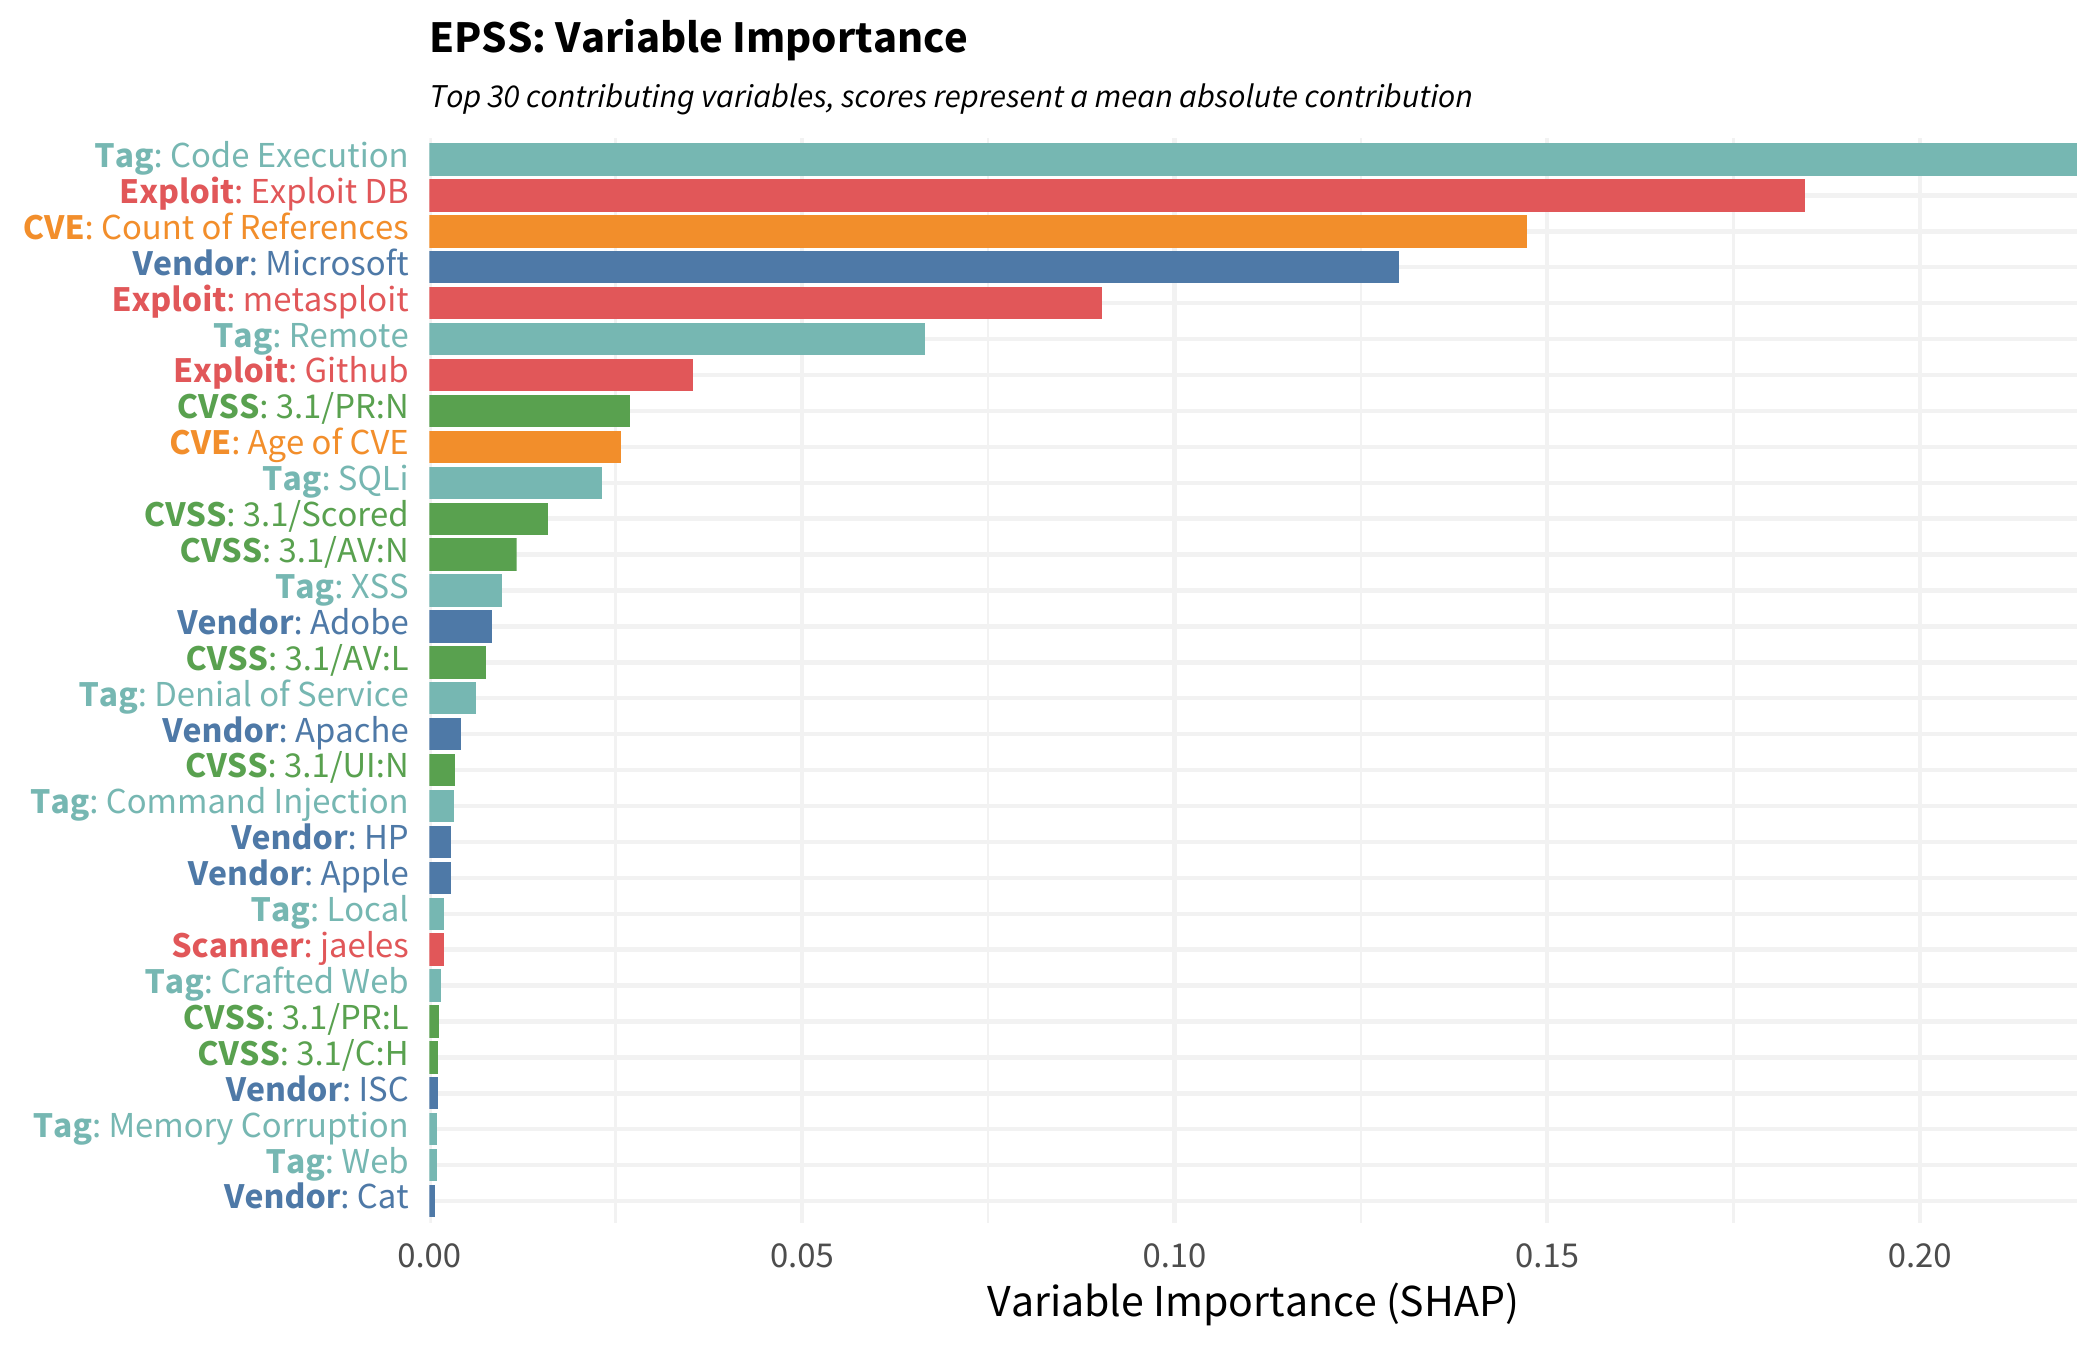
To understand individual contributions, we can break out each variable and plot each SHAP value depending on the value of that variable. In the following plot, focus on the CVE variable counting the number of references mentioned in the published CVE. If a CVE has a single reference, we would probably see a reduction in the outcome (the probability of exploitation) since the points are generally below zero. But as a CVE gets more references it tends to cross over into a positive contribution. It looks as though any CVE with more than 10 (-ish or so) references will have an increased likelihood of being exploited in the wild.
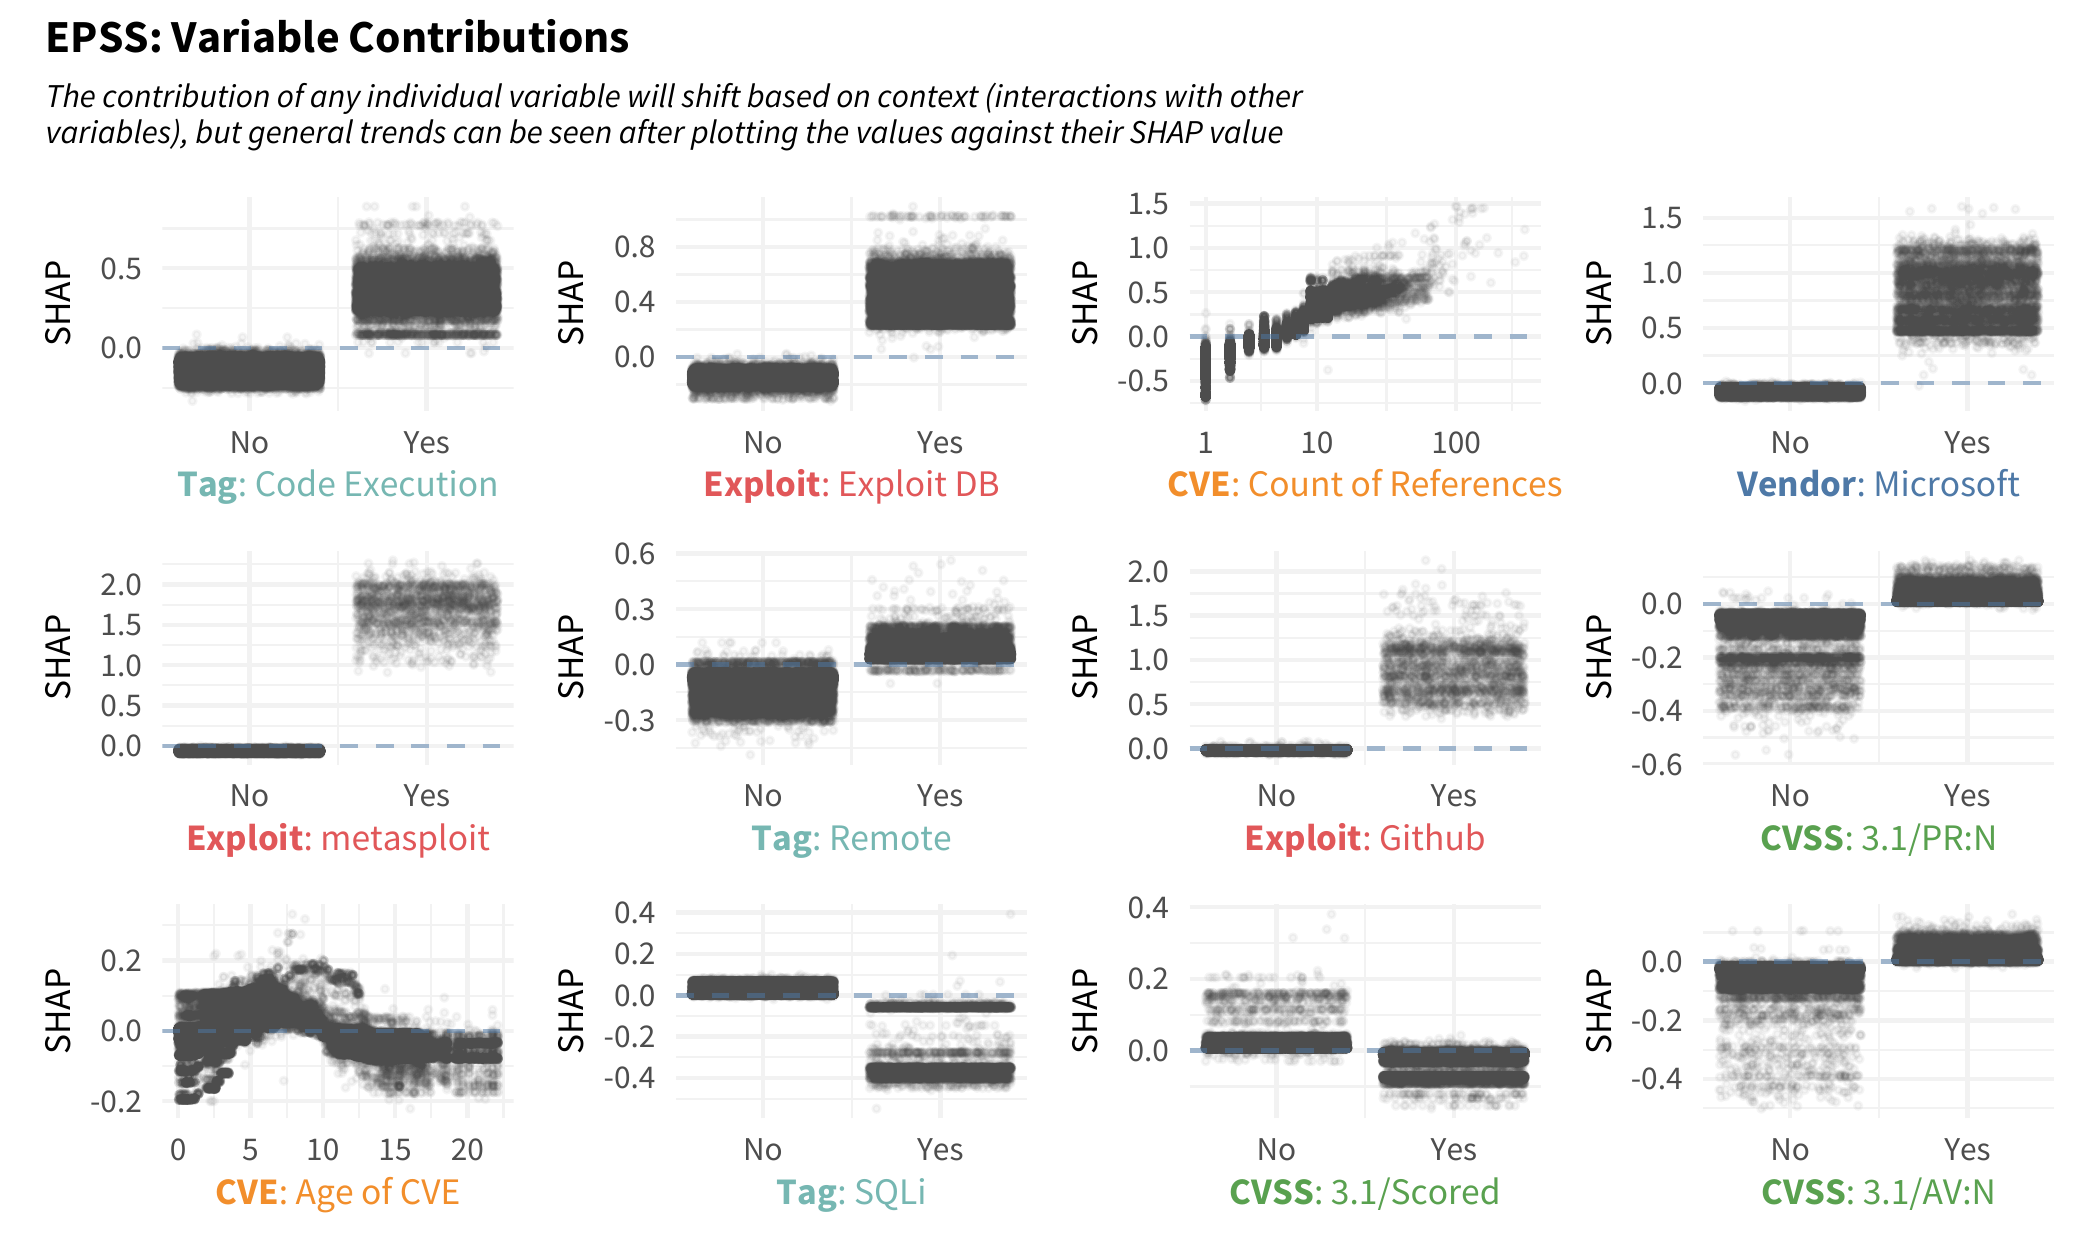
Note also the three exploit repositories. If a CVE has an exploit published to Metasploit, it has a large impact on the likelihood of observing exploitation in the wild (relatively speaking the vertical axis scale is larger for that plot). But notice also, an exploit published to github and/or exploit DB will increase the estimated likelihood for observing exploitation. Another interesting variable to talk about is the effect age has on outcome. Note that when a CVE is “new” the contribution is mixed and dependent on context, but as a CVE ages with time, there is a slight increase in exploitation which is rather interesting! It peaks around year six or seven and decreases after that, eventually becoming steady in older vulnerabilities and reducing the likelihood of observing exploitation activity.
EPSS References
Peer-Reviewed and Other Published Research
- Jay Jacobs, Sasha Romanosky, Benjamin Edwards, Michael Roytman, Idris Adjerid, (2021), Exploit Prediction Scoring System, Digital Threats Research and Practice, 2(3).
- Jay Jacobs, Sasha Romanosky, Idris Adjerid, Wade Baker, (2020), Improving Vulnerability Remediation Through Better Exploit Prediction, Journal of Cybersecurity, 6(1), https://doi.org/10.1093/cybsec/tyaa015.
- Kenna Security and Cyentia: Prioritization to Prediction Series, 2017-2022, https://www.kennasecurity.com/resources/prioritization-to-prediction-reports/
Presentations
- Exploit Prediction Scoring System, TPRC, The Research Conference On Communications, Information, and Internet Policy, February 19, 2021.
- Michael Roytman, Jay Jacobs (2019), Predictive Vulnerability Scoring System, Black Hat USA, August 3-8, Las Vegas, 2019, available at https://i.blackhat.com/USA-19/Thursday/us-19-Roytman-Predictive-Vulnerability-Scoring-System-wp.pdf.
- Jay Jacobs, Sasha Romanosky, Benjamin Edwards, Michael Roytman, Idris Adjerid (2019), Improving Vulnerability Remediation Through Better Exploit Prediction, PrivacyCon Federal Trade Commission, June 27, 2019, available at https://www.ftc.gov/news-events/events-calendar/privacycon-2019.
- Jay Jacobs, Sasha Romanosky, Benjamin Edwards, Michael Roytman, Idris Adjerid (2019), Exploit Prediction Scoring System (EPSS), 2019 Workshop on the Economics of Information Security, Boston, June 3-4, 2019.
EPSS Report for Tuesday, Sep 20, 2022
- 184,998 total CVEs scored
- 128 CVEs are newly scored
- 12,845 Views
- Mark as New
- Bookmark
- Subscribe
- Mute
- Subscribe to RSS Feed
- Permalink
- Report Inappropriate Content
09-20-2022 03:45 PM
I'm anxious to see how ServiceNow is going to enable us to use this in conjunction with CVSS and environmental variables collected from our CMDB to determine an overall risk score for assets with vulnerabilities in our environment.
- Mark as New
- Bookmark
- Subscribe
- Mute
- Subscribe to RSS Feed
- Permalink
- Report Inappropriate Content
09-02-2023 06:48 AM
Yes, it would be great as a supported integration
- Mark as New
- Bookmark
- Subscribe
- Mute
- Subscribe to RSS Feed
- Permalink
- Report Inappropriate Content
10-11-2022 06:28 PM
Recently created a POC integration to add EPSS scores to CVE entries. One of the challenges we encountered was related to the volume of EPSS scores being updated every day, which causes a lot of data churn and has downstream impacts on:
- any calculators which would incorporate EPSS
- grouping rules including a risk score
- remediation target rules
Worth giving some consideration to how it is employed and the impacts to existing configurations.
- Mark as New
- Bookmark
- Subscribe
- Mute
- Subscribe to RSS Feed
- Permalink
- Report Inappropriate Content
09-01-2023 08:11 AM
We are importing EPSS scores weekly. When there is a new vulnerability which is not in EPSS, we are defaulting to a "high" EPSS score to prevent minimizing the lack of EPSS.
Our current formula for risk score include utilizes severity level from our TVM tool as 70% of the risk score, 20% from the CVE being listed on CISA KEV, and 10% from a EPSS probability score.