- Post History
- Subscribe to RSS Feed
- Mark as New
- Mark as Read
- Bookmark
- Subscribe
- Printer Friendly Page
- Report Inappropriate Content
on 09-01-2021 05:16 AM
So, you’ve used Automation Discovery to identify automation opportunities that can be handled by Virtual Agent(VA), and you’ve gone ahead and implemented. But how do you improve the adoption of Virtual Agent? Pre-Quebec we provided a VA Insight Performance Analytics Dashboard that showed high level trends of VA such as topic rankings, abandoned conversations, and conversation duration. But we were never able to dig much deeper into those high-level trends. In Quebec we’ve introduced a new Conversational Analytics dashboard using the new Seismic UX; this new dashboard gives us a deeper library of metrics as well as the ability to drill into the effectiveness of our VA conversations in real time a node level.
In this article I’ll focus on how a developer can leverage Conversational Analytics to drive better Virtual Agent adoption. If you’re new to Conversational Analytics be sure to visit Virtual Agent Academy for a comprehensive overview of Conversational Analytics.
When we open Conversational Analytics we are presented with the Overview page (fig1). This page provides high level trends on new metrics such as deflection patterns, active VA users, as well as success of all the active VA topics. We can specify the time frame on the top right (in this case the last three months).

We can also drill into the details of any metric such as deflection count to see the time series trend (fig2). In this case we see a disturbing trend that our deflection rates are going down and we can ask ourselves “what topics aren’t being used to deflect?” Note you can also override the formulas for metrics such as “deflection count” or create your own metrics. Please see the Quebec documentation for details.

Scrolling down the Overview dashboard allows me to review the Incomplete VA topics (fig3) that may be negatively impacting our deflection trend. These are topics where users exited the conversation and either went to a Live Agent or directly opened a ticket; both scenarios negatively impact our deflection rates. We see that software access has 17 incomplete conversations.

Clicking into software access from the bar chart(fig4) allows me to see details on how users are interacting with the interacting with the Software Access VA topic. I see that usage has gone down since August 16th and that none of the conversations went to a live agent. More importantly I can see patterns of the Last visited node for the incomplete topics. In this case I notice that the SAPModule node that I added last week was the last visited node for a couple conversations. This is concerning as this new improvement was supposed to improve deflection for SAP software access issues.

Armed with this knowledge that users are getting stuck at the SAPModule node I review my VA topic design and quickly see the issue. I kept the abbreviated SAP internal application names of EMEA Finance, AMS HR, AMS Finance in the choice list when I promoted this topic to production. What is probably happening is that the end user doesn’t understand which SAP application to select (fig5) and they are exiting VA at this step of the conversational flow.

(fig5 – Topic flow for Software Access)
I’d also like to understand the amount of time users spend in the SAPModule step. To do that I can click on the Conversations Page and create a filter to focus on SoftwareAccess, completion status = false, and end state is Auto Closed (fig6).

(fig6 – filter on the conversations page)
The result shows me that the user spent a total of 24 seconds in the SoftwareAccess conversation and spent 12 seconds on the SAPModule step (fig7).

(fig7 – amount of time spent on SAPModule step)
I also quickly check the NLU prediction page to make sure that there aren’t any incorrect predictions for the Software access VA topic. Everything looks clear and I see a downward trend of incorrect predictions for NLU - which is also good. Futhermore, I can launch into the NLU workbench by clicking the View more button for more advanced analysis.

This is powerful information that I can use to improve adoption. Conversational analytics allowed me to see that my VA deflection rate was trending downward, it identified incomplete topics that were impacting the deflection rate, and most importantly from a developer perspective allowed me to optimize my VA topic design by showing what VA nodes or NLU intents in the conversation flow caused issues and the time spent on each step.
I hope you enjoyed this short article on how you can use Conversational Analytics to improve VA adoption in your organization. For more information, please see the Quebec documentation.
- 11,333 Views
- Mark as Read
- Mark as New
- Bookmark
- Permalink
- Report Inappropriate Content
Really great article Lener.
- Mark as Read
- Mark as New
- Bookmark
- Permalink
- Report Inappropriate Content
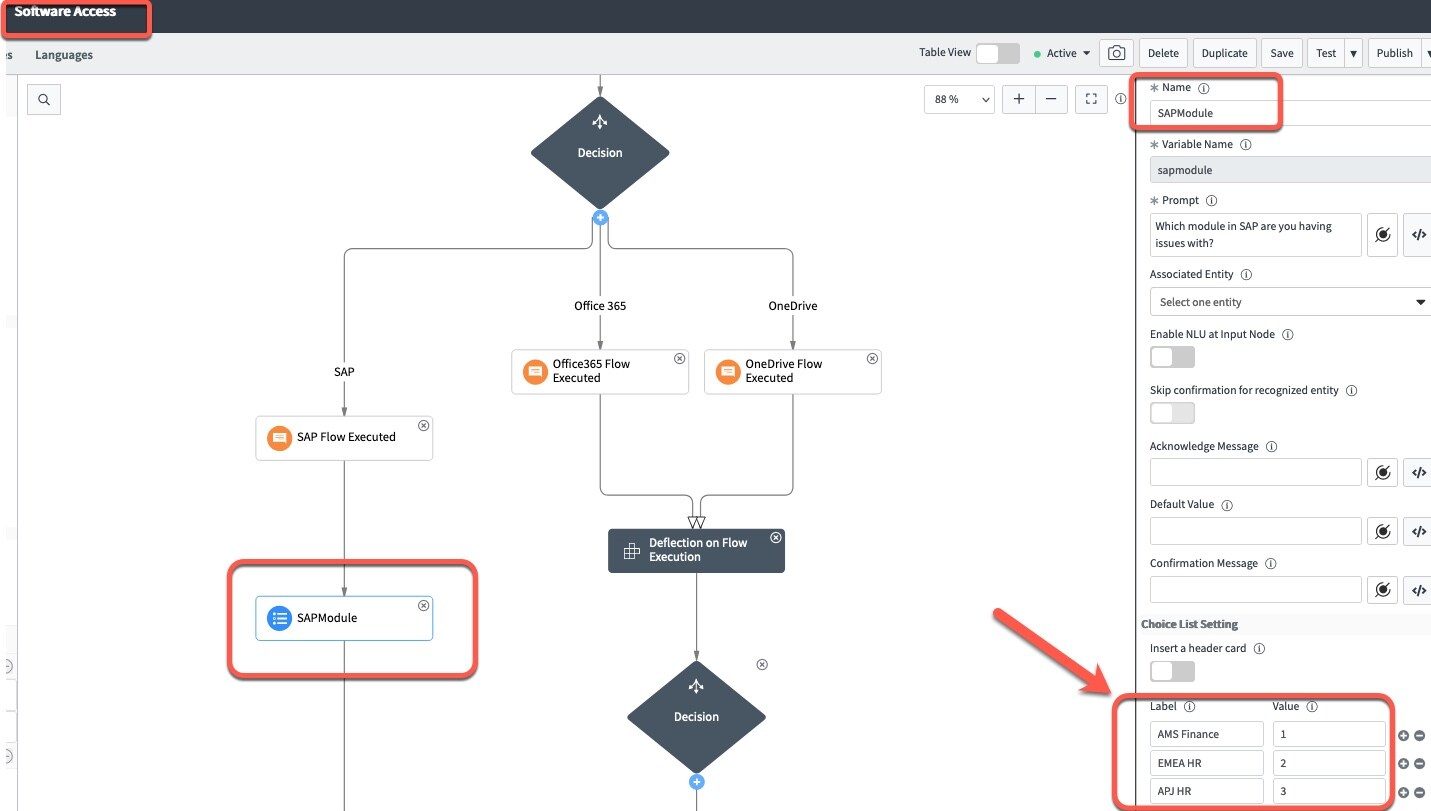
Pro TIP - Use VA table view. In this article we identified the SAP Module node as a potential problem area because users are exiting this node and not completing the conversation. To quickly find the offending node it helps to go into VA designer table view, this allows us to search large VA topics.
Steps
1) Go to > Virtual Agent Designer > Software Access
2) Toggle to table view
3) Search for SAP
4) Select the SAPModule node
5) Examine the properties of that node

- Mark as Read
- Mark as New
- Bookmark
- Permalink
- Report Inappropriate Content
Virtual Agent Conversational Analytics Dashboard - Is this covered under existing VA Package if customer already has it or subscription should be taken separately?
- Mark as Read
- Mark as New
- Bookmark
- Permalink
- Report Inappropriate Content
If you go into the ServicenowStore > conversational analytics and enter your instance name it will automatically check if your instance has a valid subscription for Conversational Analytics.
In general as long as you have a VA license through ITSM Pro, CSM Pro, or HR Enterprise you should be covered. Not sure if VA lite is covered. I would reach out to the sales team supporting the customer to be 100% certain.

- Mark as Read
- Mark as New
- Bookmark
- Permalink
- Report Inappropriate Content
We are not getting any stats for Deflections on the Dashboard after installing the App. The documentation isn't too clear on how this is achieved, would we also need to add the Deflection Topic Block to our custom Topics and tie that to a deflection pattern?
The documentation states: 'The Virtual Agent deflection tracking is enabled by default, but you must set up the deflection configuration and deflection patterns to capture certain deflection metrics. For more information, see Create deflection configurations and patterns.'
We have the OOTB patterns which look fine, but I presume that we also need to add a Deletion Topic block to our custom topics. The documentation doesn't make this exactly clear(as least to me :))

- Mark as Read
- Mark as New
- Bookmark
- Permalink
- Report Inappropriate Content
- Mark as Read
- Mark as New
- Bookmark
- Permalink
- Report Inappropriate Content
Hi ,
in my dashboard data is not showing, is there any scheduled jobs or how can we show the data
- Mark as Read
- Mark as New
- Bookmark
- Permalink
- Report Inappropriate Content
Hi Laxman, Conversational Analytics doesn't have any scheduled jobs (aka data collectors) like Performance Analytics. Conversational Analytics shows real time data, so try opening up Virtual Agent from your Service Portal/ESC and start 10 conversations. Vary the VA conversations by completing the entire conversation or existing out by hitting the "x". This should populate your dashboard.
- Mark as Read
- Mark as New
- Bookmark
- Permalink
- Report Inappropriate Content
There is a background job just automatically runs constantly. You don't have to do anything. If you'd like to run immediately, go to Scheduled Jobs > Conversation Analytics ETL > Execute Now button. If data still does not show after a couple hours of using the Virtual Agent, log a Case.
- Mark as Read
- Mark as New
- Bookmark
- Permalink
- Report Inappropriate Content