- Post History
- Subscribe to RSS Feed
- Mark as New
- Mark as Read
- Bookmark
- Subscribe
- Printer Friendly Page
- Report Inappropriate Content
on 12-17-2021 06:30 AM
In this article, I will go over the CMDB health dashboard metrics and how they are computed, and what each of them indicates. CMDB Helathdashboard is very useful to analyze the overall health of CMDB.
Health Dashboard Overview:
Health Dashboard is divided into three parent metrics(Completeness, Correctness, Compliance) and each of the parent metrics contain child metrics and can be observed in the below image.

Generating the Report:
Health dashboard report can be generated by running CMDB Health Dashboard jobs (Completeness Score Calculation, Correctness Score Calculation, Compliance Score Calculation) and these can be accessed from CMDB View -> CMDB Health Dashboard Jobs
Understanding the numbers:

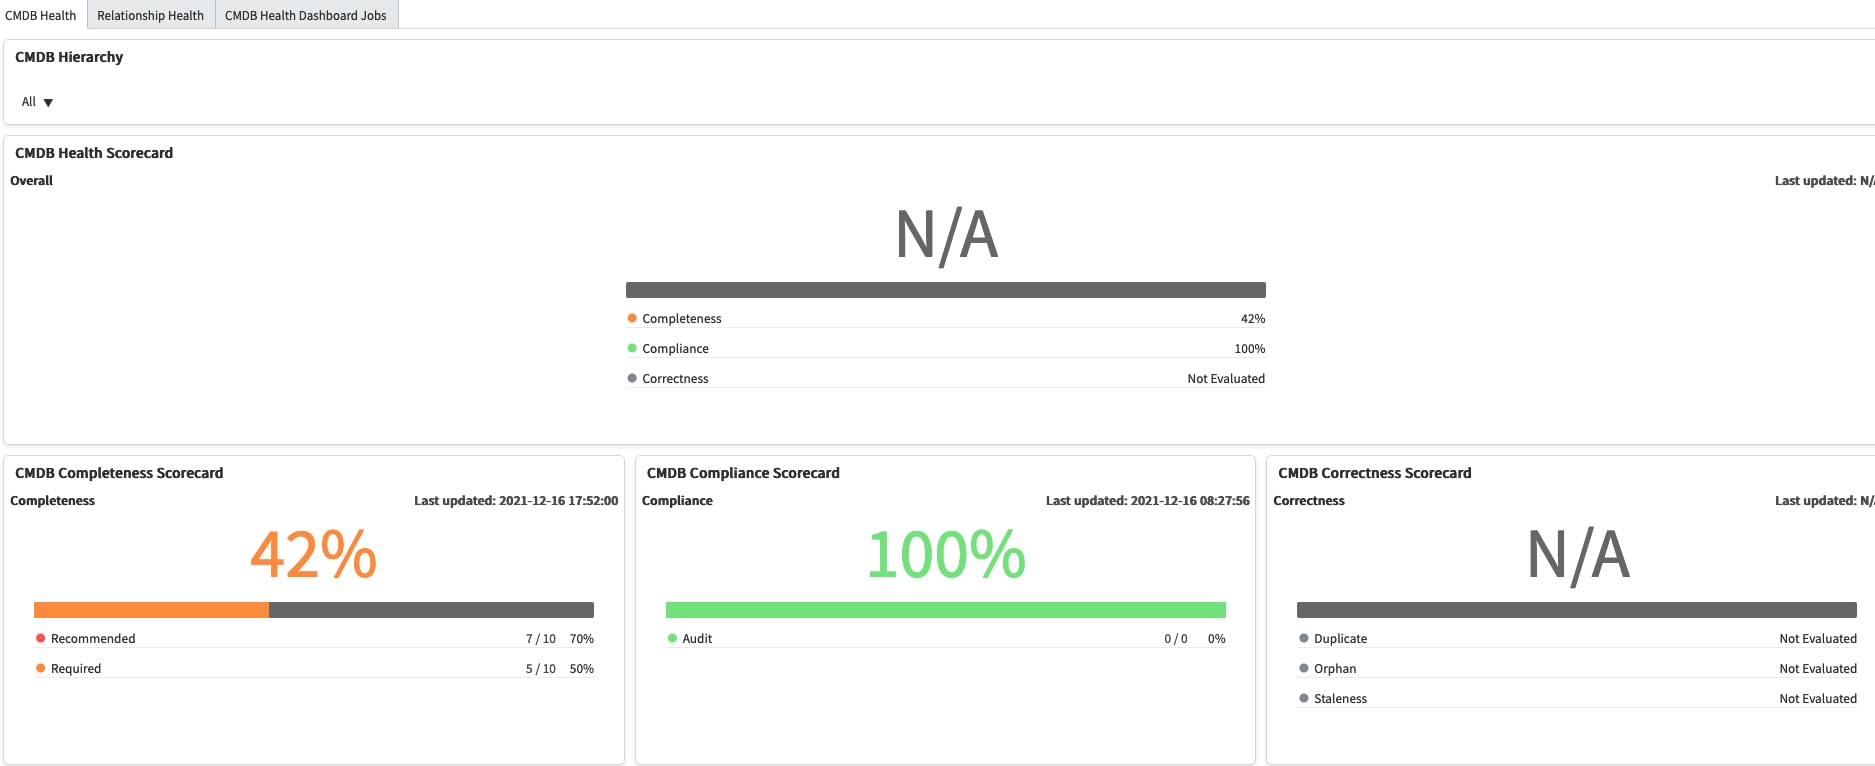
I will use Completeness as an example to go over the numbers, Completeness has two sub metrics Required and Recommended. When the Completeness Score Calculation job is run, for each sub metric it will analyze all the CI's in the CMDB according to the rules defined in the CMDB and will generate the failures and will save them to the cmdb_health_result table.
1. In the above example for recommended we have 7 failures out of total 10 CI's that are analyzed and for required there are 5 failures for a total 10 Ci's that are analyzed. The percentage of those numbers failures/total *100 is represented next to it.
The total number of CI's includes only Ci's that are analyzed. If there are any inclusion rules and if certain CI's are excluded using it then those CI's will not be included in the total count.
2. Each metric has weights configured by default and can be viewed from Health Preference -> Health Metric -> Select Metric. For Completeness default weights for recommended and required are 40 and 60 respectively.

The weighted score of the parent metric is computed by using the below formula.
weightedScore += ((total-failures)*weight)/total.
In above example, For completeness the required yields ( (10-5)*60)/10 = 30 and the recommended yields ((10-7)*40)/10 = 12, overall score for completeness is 30+12 = 42%
Overall Score:
Overall Metric also has the weights corresponding to each of the parent metrics and can be configured using the same health preference described previously(Health Preference -> Health Metric -> Select Metric(Overall)). The default weights for each parent metrics are Completeness(34), Compliance(33), Correctness(33).
The overall score is computed using the below formula.
weightedScore += (metricWeight*metricScore)/100.00
In above example, For completeness( 34*42)/100 = 14.28 , Compliance (33*100)/100 = 33 as no records are evaluated, Correctness (33*100)/100 = 33 as no records are evaluated and overall score 14.28+33+33 = 80 (rounded down)
Domain separation also uses the same approach when computing the score for each metric type.
- 9,557 Views
- Mark as Read
- Mark as New
- Bookmark
- Permalink
- Report Inappropriate Content
Quick question, what is the standard CMDB Health Dashboard percentage any org must achieve. is it 90% or greater than 95%
- Mark as Read
- Mark as New
- Bookmark
- Permalink
- Report Inappropriate Content
I have a question regarding the CMDB Health Dashboard Jobs, I have access to CMDB health dashboard and reports however I don't see any CMDB Health Dashboard Jobs when I clicked it.

- Mark as Read
- Mark as New
- Bookmark
- Permalink
- Report Inappropriate Content
Hi @Mon22 , CMDB Health Dashboard jobs are disabled by default. Enable and configure the respective job for the CMDB health KPI that you want data collected and aggregated for. (Enable and configure a CMDB Health Dashboard job)
- Mark as Read
- Mark as New
- Bookmark
- Permalink
- Report Inappropriate Content
Hello,
Are the OOB thresholds for the CMDB Scorecards considered best practice?
Ex.

If not, what percentage would be considered the industry best practice for a healthy CMDB?