- Mark as New
- Bookmark
- Subscribe
- Mute
- Subscribe to RSS Feed
- Permalink
- Report Inappropriate Content
07-11-2022 02:12 PM
Hi,
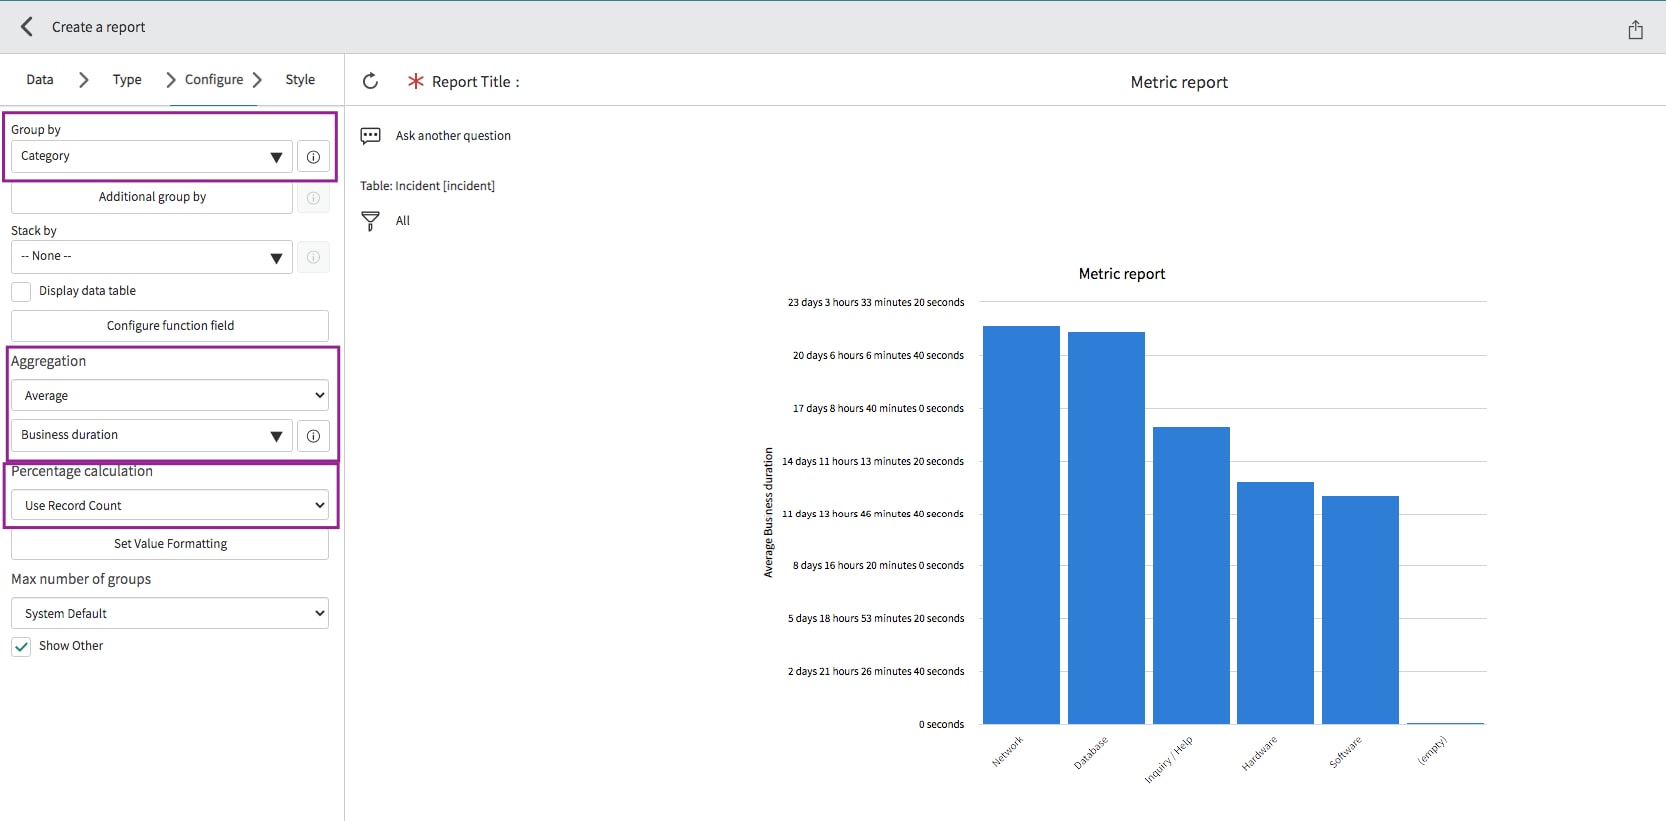
I'm trying to create a report that shows categories on the case table on the x-axis and the average days it takes to solve the cases in each type on y-axis as a bar chart. This is a custom table inheriting from the customer service case table.
Created a report based on task SLA table but that shows the resolution time as a range - how many cases closed in a day, 1-2 days, <1 week etc..
It doesn't give the average days to resolve per category. I tried using the metric table as well but didn't work. Is there something I can do to get this information? PA reports is an option but I don't want to do that if I don't have to.
The pic below is what I'm looking for. I'm not getting correct numbers here.
Thanks!

Solved! Go to Solution.
- Mark as New
- Bookmark
- Subscribe
- Mute
- Subscribe to RSS Feed
- Permalink
- Report Inappropriate Content
07-11-2022 07:43 PM
Hi MS
It would be best if you used the aggregation option in the report, go for a Bar report and try this option.

Thanks
- Mark as New
- Bookmark
- Subscribe
- Mute
- Subscribe to RSS Feed
- Permalink
- Report Inappropriate Content
07-11-2022 07:43 PM
- Mark as New
- Bookmark
- Subscribe
- Mute
- Subscribe to RSS Feed
- Permalink
- Report Inappropriate Content
07-20-2022 08:19 AM
This was helpful. Thank you!