


sabell2012

Mega Sage
Options
- Subscribe to RSS Feed
- Mark as New
- Mark as Read
- Bookmark
- Subscribe
- Printer Friendly Page
- Report Inappropriate Content
04-19-2017
01:21 PM
NOTE: MY POSTINGS REFLECT MY OWN VIEWS AND DO NOT NECESSARILY REPRESENT THE VIEWS OF MY EMPLOYER, ACCENTURE.
DIFFICULTY LEVEL: INTERMEDIATE
Assumes basic knowledge and/or familiarity of the Studio IDE, and Scripting in ServiceNow.
____________________________________________________________________________
In my previous article I describe the various console logs, and client-side debugging tools available to developers. We created a Studio application to help us test these features. I also described a bit of the Client Script debugging. In this article I will show some of the server-side tools available to the client-side, and how they can be utilized for debugging.
Pre-requisite: Work through the labs in my previous article.
Client Side Debugging of Scripts
The first tool for debugging server-side scripts on the client can be found under System Diagnostics. This basically allows you to debug Business Rules and a handful of other things. While not necessarily a Scoped Scripting debugging tool; it still needs to be included in a survey of ServiceNow debugging tools.
1. Navigate to System Application > Studio and open your Debugging Logger application from the previous article.
2. Click on Create Application File and create a new Business Rule.
3. Fill out the form with the following:
Name: Debugging — Scoped
Table: Incident
Active: Checked
Advanced: Checked
Under the When to Run Tab:
When: Before
Update: Checked
Order: 100
Under the Advanced Tab:
Script:
(function executeRule(current, previous /*null when async*/) {
var number = current.number;
gs.info('---> Number: {0}', [number]);
})(current, previous);
4. Click on the Submit button to save your work.
5. From your Instance navigate to System Diagnostics > Session Debug > Debug Business Rule. The Business Rule Debugger will be activated.
Note: Debug Business Rule (Details) expands, considerably, what is logged to the client-side interface. I rarely use this feature as there is usually just too much info to sort through. Try it out though. It has its uses.
6. Navigate to Incidents and open your favorite incident.
7. To execute our Business Rule we need to update the record. Change one of the fields and save, don't update, the Incident record.
8. On the Incident form scroll to the bottom of the form past the related lists. You will see debugging information listed. This is really useful to see if, and in what order, your Business Rules fire. Note the millisecond indicator on the log entries. Gosh I wish we had this in the System Log!

9. Scroll down a bit further and you will see that our business rule was executed. You won't see the output here though. That will appear in our system log.

10. Navigate to System Logs > System Log > All and search for message contains "--->". You log message should look something like this:

Ok, so that was interesting, and it has its uses. Now let's move onto something really cool that was re-introduced with the Istanbul release: The Script Debugger!
Script Debugger — Breakpoints
Re-introduced in that it made its first appearance in the Fuji release, but the big User Interface changes in Geneva appear to have cause problems, and we lost this really useful tool for a couple of releases. Now it's back! Whoop!
So how do we use it?
1. From the Studio open our new Business Rule: Debugging — Scoped.
2. Click on line number 3 of your script. A blue highlight will appear. This is your breakpoint. You can set one of these per line.
3. Now click on the Script Debugger button (last icon on the Script field) to open the debugger window.

4. When the Script Debugger window opens you will see your Business Rule's script with the breakpoint highlighted. This window MUST be open in order for debugging to work. So do not close this window. It is okay for it to be minimized though.

5. Back in your instance open your favorite Incident again, change something on the form, and save - to cause our Business Rule to fire. Because we have the Script Debugger window still open it causes the ServiceNow Script Debugger popup to be shown.
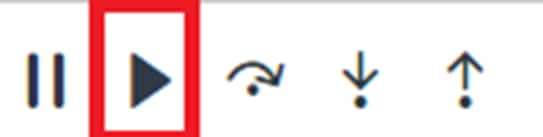
6. Click on the Start Debugging button.

7. This will cause the Script Debugger to be brought up to the forefront, and will cause execution to stop on the specified breakpoint.

8. Here you will be able to see all sorts of information about everything currently executing. Note the Call Stack in the upper left corner. This lets us see what function is calling what (it is in reverse order). Below that is the Transaction Detail. Here you can look down through all of the request parameters used when executing the script. Finally on the upper right side you can see all of the variables that have been populated. In this case since we are using a Business Rule you can see both the Current and Previous objects and their property values. I really find this tool useful. One note of caution: If you leave it sitting very long the breakpoint will timeout and execution will cease.
NOTE: You can only stop on breakpoints set in script executed by synchronous calls. Therefore anything Async (i.e. Ajax, Events, Scheduled Jobs) will not fire the debugger even if you have everything set up right. Also, the Script Debugger does NOT work in Fix Scripts even though they are Async.
9. Click on the Start button to continue and finish execution. You can close the Script Debugger window now.

That introduces the Script Debugger. You can set breakpoints and bring up the Script Debugger window from the Studio, but in order to get it all to work you have to execute, some script that has a breakpoint, from the instance.
In my next, and final article (Mini-Lab: Scoped Debugging and Logging — Part 3) on this topic, I will be covering:
Scoped Logging
Scoped Debug Logging
Fix Scripts
Server-Side Logging Techniques
Steven Bell
For a list of all of my articles: Community Code Snippets: Articles List to Date
Please Share, Like, Bookmark, Mark Helpful, or Comment this blog if you've found it helpful or insightful.
Also, if you are not already, I would like to encourage you to become a member of our blog!
You must be a registered user to add a comment. If you've already registered, sign in. Otherwise, register and sign in.
