


sabell2012

Mega Sage
Options
- Subscribe to RSS Feed
- Mark as New
- Mark as Read
- Bookmark
- Subscribe
- Printer Friendly Page
- Report Inappropriate Content
04-21-2017
05:45 AM
NOTE: MY POSTINGS REFLECT MY OWN VIEWS AND DO NOT NECESSARILY REPRESENT THE VIEWS OF MY EMPLOYER, ACCENTURE.
DIFFICULTY LEVEL: INTERMEDIATE
Assumes basic knowledge and/or familiarity of the Studio IDE, and Scripting in ServiceNow.
____________________________________________________________________________
In my last two articles I brought up client and server-side debugging when working with a Scoped Application. In this article I will be bringing several server-side techniques together, and show what can actually be done from within the Studio!
Mini-Lab: Scoped Debugging and Logging — Part 1 (Create a Studio App, and client-side debugging tools and tips)
Mini-Lab: Scoped Debugging and Logging — Part 2 (System Diagnostics Debugger, Script Debugger!)
Logging
In previous articles I mention a variety of ways to do logging. Here again I want to bring up our old friends: gs.info, gs.warn, gs.error, gs.debug
Remember: gs.log does NOT worked in Scoped Applications.
When working with Scoped Applications there is a slight twist to using these. If you are doing any sort of variable substitution you will need to surround the parameters with square brackets. Even if there is only one variable to be substituted.
Example:
gs.info('---> Hello world! {0}-{1}', [new GlideDate(), 'My Script Name']);
Notice the brackets? This is a zero-base array. The first value would be the current date, and the second the string 'My Script Name'. Easy.
NOTE: In Global scoping the brackets are not necessary as long as you have no more than five parameters. These days I always include the brackets regardless.
Fix Scripts
This nifty mechanism gives us a way of modeling code before putting it into our Script Includes or Business Rules. Even better: These can be run from inside of the Studio!
So, let's come up with an example that will use Fix Scripts to model our code, and then allow us to use that code immediately inside of a Script Include to be consumed by a Business Rule. Our Script Include would log all of the other Incidents associated by the current Incident's Problem field. This would require we set up the data so that our current Incident has an associated Problem record; that in turn has other related Incidents. Our Script Include would retrieve all records from the Incident table for that given Problem ID. Finally, we would need to call the Script Include from a Business Rule (the one we created in the previous article will do nicely).
Blah, blah. If that last paragraph didn't make sense, then hang in there! All will be clear as you move through the lab!
Pre-Work:
1. Go to your favorite incident. If the problem field is not on the form you will need to add it. Copy and record the Problem number. If one doesn't exist just pick one and add it to the field.
2. Click on the information button to the right of the Problem field to bring up the Problem record.
3. Right Click on the form header and copy and record the sys_id. Recording the sys_id and the Problem number is important as we need this data as inputs in our Fix Script.
NOTE: In the incident I chose the Problem sys_id was: 9d3a266ac6112287004e37fb2ceb0133, and the problem number was: PRB0000007
4. Make sure there are at least two Incidents associated to the Problem record. You may have to add a couple of Incidents. We need at least two for testing purposes.
Building The Fix Script
Let's create a simple Fix Script that we will then build upon toward the final Script Include.
1. In the Studio Application from the Part 1 article click on the Create Application File button.
2. Type Fix Script in the filter field, and click on the Create button.
3. Fill in the form with the following:
Name: Logging Tester
Active: checked
Run Once: checked
Description: Test of the various logging techniques
Demonstrates: Millisecond Logging, Cumulative Message Logging
Script:
var location = 'FS:Logging Tester';
var problemID = ' <<put sysid here>>';
var problemNumber = '<<put problem number here>>'; // ibid.
loggingTest(problemID, problemNumber);
function loggingTest(problemID, problemNumber) {
gs.info('---> [{2}-{3}]\nID: {0}\nNumber: {1}',
[problemID, problemNumber,
new GlideDateTime().getNumericValue(), location]);
}
4. Click on the Submit button to save your work.
5. Click on the Run Fix Script related link to run your script. Notice that you do NOT have to jump to your instance to do this! You can stay in the Studio!
6. The Run Fix Script form will be displayed. Click on the Ok button to continue.
7. The Warning form will be displayed. Click on the Proceed button to continue.
8. You should get something that looks like this:

9. Click on the Close button to return to the Studio.
Pretty cool huh?! You can test code snippets from inside of the Studio! Notice that the milliseconds are placed into the text of the logged output. This is a technique that allows us to order our messages properly inside of the System Log. The need for this will become more obvious as we go along.
Next, let's beef up our function to retrieve all incidents that have that ProblemID. We will need a GlideRecord, and some way of gathering up the information and putting it into the log. We will use gs.info with the millisecond technique.
BTW, it is considered a best practice to embed the location that the log message originated from.
10. Modify the Script:
var problemID = '9d3a266ac6112287004e37fb2ceb0133'; // retrieved from problem table
var problemNumber = 'PRB0000007'; // ibid.
loggingTest(problemID, problemNumber);
function loggingTest(problemID, problemNumber) {
var location = 'FS:Logging Tester';
gs.info('---> [{2}-{3}]\nID: {0}\nNumber: {1}',
[problemID, problemNumber,
new GlideDateTime().getNumericValue(), location]);
var incidents = new GlideRecord('incident');
incidents.addQuery('problem_id', problemID);
incidents.query();
while (incidents.next()) {
gs.info('---> [{1}-{2}]\nIncident Number: {0}',
[incidents.getValue('number'),
new GlideDateTime().getNumericValue(), location]);
}
}
11. Save your Fix Script.
12. Run the Fix Script. Your result should look something like this:
13. Click on the Close button to continue.
14. From your instance navigate to System Logs > System Log > All.
15. Filter today's logs with: ---> [14927
16. Order by Message descending. Your List View should look something like this:

Notice the Created date? For me I had all three of my new messages entered in the log on the same second! Without the millisecond entries in the Message field I wouldn't have a clue about which order they had really been placed there.
Let's go back to our Studio, and try a different technique for preserving the order. I use a variable to collect the messages; then print them all out at once. It isn't as safe as just printing each off as we get to them, but it looks nicer in the log (sic. easier to read). We will also use Try/Catch as a best practice around our code, and use gs.error if an error should occur.
17. Modify the Script:
function loggingTest(problemID, problemNumber) {
try {
var location = 'FS:Logging Tester';
var message = '--->\n';
message += 'ID: ' + problemID + '\n';
message += 'Number: ' + problemNumber + '\n';
var incidents = new GlideRecord('incident');
incidents.addQuery('problem_id', problemID);
incidents.query();
while (incidents.next()) {
message += 'Incident Number: ' + incidents.getValue('number') + '\n';
}
gs.info('---> [{1}-{2}] {0}',
[message,
new GlideDateTime().getNumericValue(), location]);
}
catch (err) {
gs.error('---> [{2}-{3}]\n{0}\n{1}',
[err, message,
new GlideDateTime().getNumericValue(), location]);
}
}
18. Save your Fix Script.
19. Run the Fix Script. Your result should look something like this:

In the log you should see this:

A lot cleaner and neater, but if things blow up you might lose it all. Thus the reason for writing down what you had so far in the gs.error.
With my next example we will swap out our gs.info messages with gs.debug. This is something that works really well within scoped applications; in that you can have a switch to turn the logging off in Production that is specific to just your scoped application! Additionally I will demonstrate a technique to merge the two logging methods just demonstrated.
20. Modify the Script:
var problemID = '9d3a266ac6112287004e37fb2ceb0133'; // retrieved from problem table
var problemNumber = 'PRB0000007'; // ibid.
loggingTest(problemID, problemNumber);
function loggingTest(problemID, problemNumber) {
try {
var location = 'FS:Logging Tester';
var message = gs.getMessage('---> [{2}-{3}]\nID: {0}\nNumber: {1}\n',
[problemID, problemNumber,
new GlideDateTime().getNumericValue(), location]);
var incidents = new GlideRecord('incident');
incidents.addQuery('problem_id', problemID);
incidents.query();
while (incidents.next()) {
message += 'Incident Number: ' + incidents.getValue('number') + '\n';
}
gs.debug(message);
}
catch (err) {
gs.error('---> {0}\n{1}', [err, message]);
}
}
NOTE: That even though the gs.getMessage function is normally used for internationalization we can still use its variable replacement capability for our own logging purposes! This allows us to merge the two techniques and clean up our code a bit at the same time. Notice that the gs.info has been replaced with a gs.debug. In the next few steps I will show you how to be able to control turning on or off your logging messages.
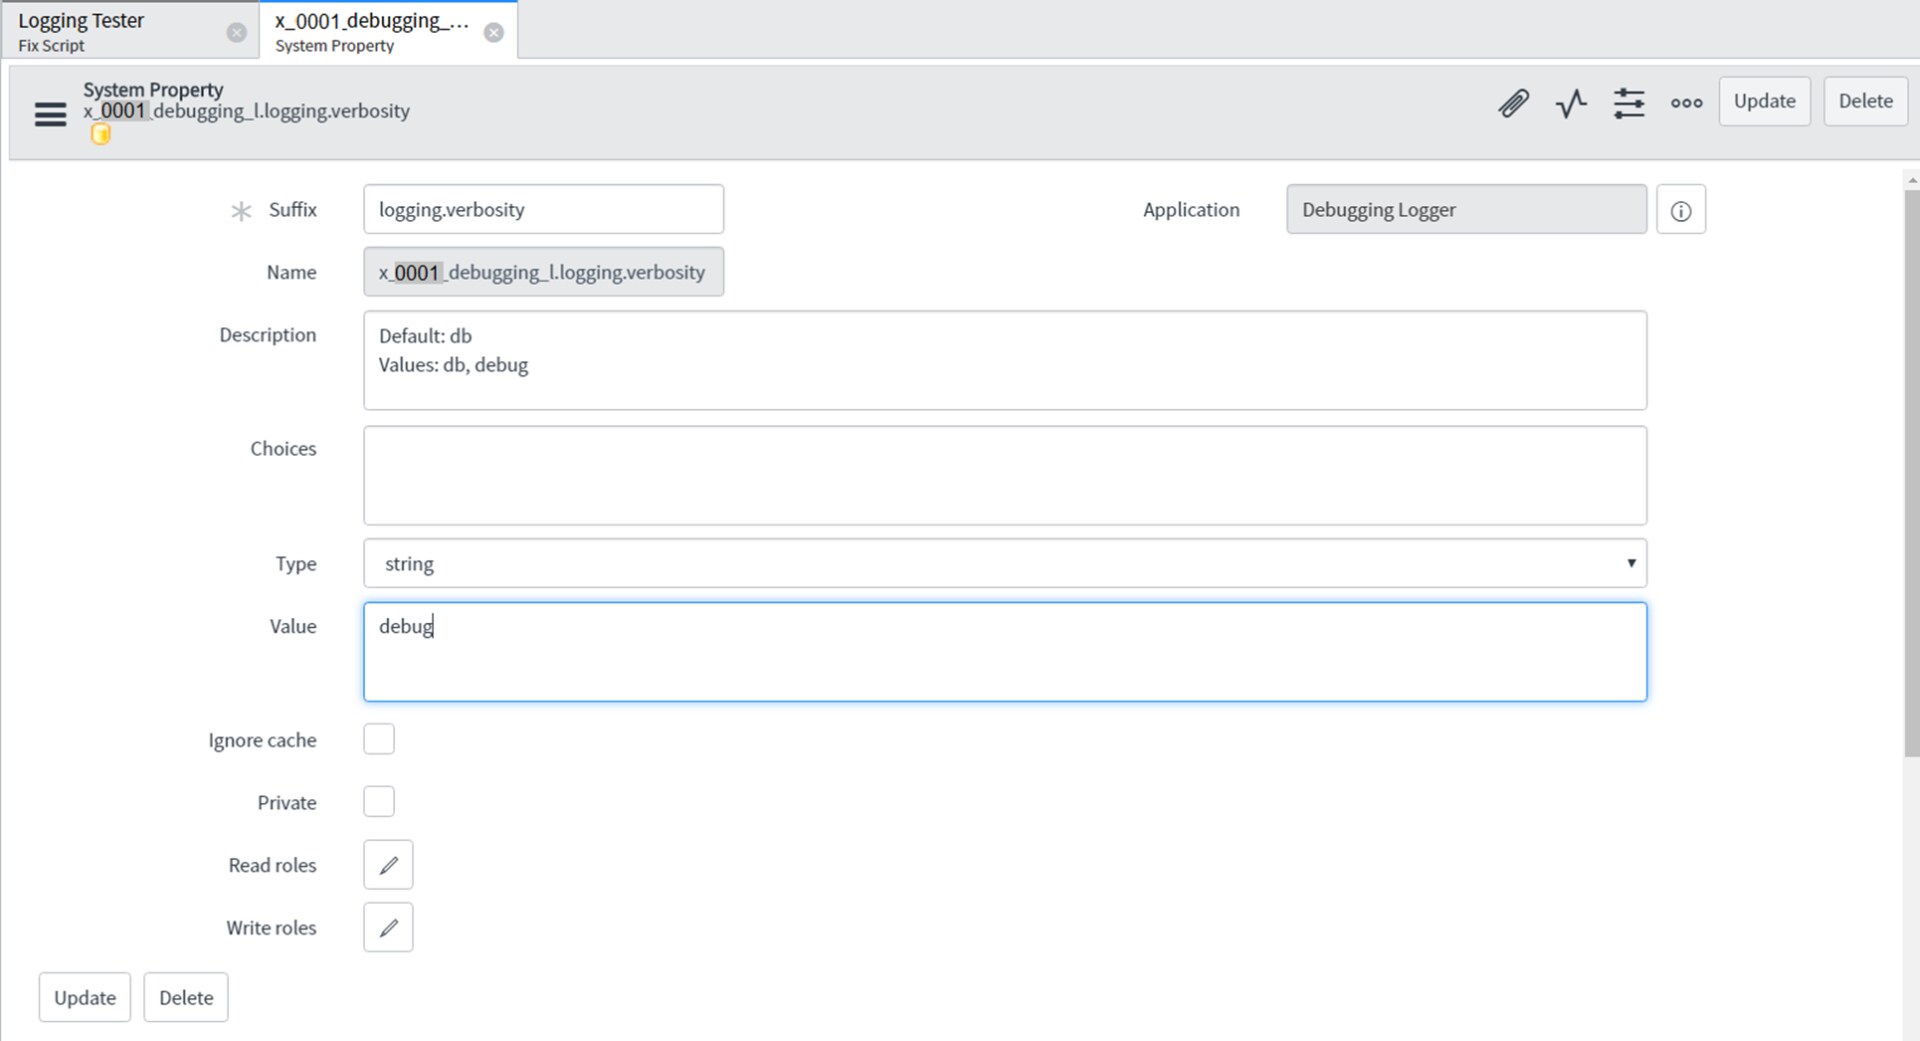
21. Click on the Create Application File button.
22. Filter for System Property, and click on the Create button.
23. Fill out the form with the following:
Suffix: logging.verbosity
Description: Default: db
Values: db, debug
Type string
Value: debug
24. Click on Submit to save your new property.

Default this is "db" for your project. Which is in essence: turn logging off. When you change the value to debug this turns logging on. This is a great feature to include in your scoped application for debugging in production; should an issue arise. Use production log messages sparingly however! You really shouldn't have a lot of logging messages embedded in your code when it moves to production anyway! I only target potential problem spots if something worries me. Consider it fire insurance. 🙂
25. Go back and run your Fix Script.
26. Your result should look something like this now:
Note the DEBUG statement that is shown.
27. From your Instance take a look at the system logs. You won't find the message here! This is because gs.debug does not appear to work from within Fix Scripts!
Now that we have all the logic worked out in our Fix Script it is time to switch it over to a Script Include. This is pretty easy actually as we will be pulling the contents of our Fix Script function over intact to the new Script Include.
By now you should be really getting used to using a Fix Script from within the Studio! That was on purpose. 🙂
Script Include
1. From in the Studio click on the Create Application File button. Filter for Script Include and click on the Create button.
2. Fill out the form with the following:
Name: LoggingScoped
Description: Usage: new LoggingScoped().loggingTest(id, number)
Accessible From: This application scope only
Active: checked
Script:
var LoggingScoped = Class.create();
LoggingScoped.prototype = {
initialize: function() {
},
loggingTest: function(problemID, problemNumber) {
try {
var location = 'SI:Logging Scoped';
var message = gs.getMessage('---> [{2}-{3}]\nID: {0}\nNumber: {1}\n',
[problemID, problemNumber,
new GlideDateTime().getNumericValue(), location]);
var incidents = new GlideRecord('incident');
incidents.addQuery('problem_id', problemID);
incidents.query();
while (incidents.next()) {
message += 'Incident Number: ' + incidents.getValue('number') + '\n';
}
gs.debug(message);
}
catch (err) {
gs.error('---> {0}\n{1}', [err, message]);
}
},
type: 'LoggingScoped'
};
NOTE: You will need to change the location variable to reflect the new location.
3. Click on the Submit button to save your new Script Include.
4. Open the Business Rule you created in the last lab (Debugging — Scoped).
5. Change the Script:
(function executeRule(current, previous /*null when async*/) {
var location = 'BR:Debugging - Scoped';
var number = current.number;
gs.debug('---> [{1}-{2}]\nNumber: {0}\n',
[number, new GlideDateTime().getNumericValue(), location]);
new LoggingScoped().loggingTest(current.problem_id, current.problem_id.number);
})(current, previous);
NOTE: Because the Problem field on the form is a related field you can drill down to the Problem record to retrieve the Number field contents. Also, note that the gs.info has been swapped out for gs.debug.
Now for our final test.
6. In your instance navigate to Incident > Open, and open your prepared incident (remember the pre-work?). Change the value of one of the fields and save the form.
7. Navigate to System Logs > System Log > All and filter for ---> [149 again. Order the Messages descending.
8. You should see your debug statements listed.

Notice that the Level field in the logs changed from Information to Debug? This is nice in that it gives you one more thing you can filter on.
NOTE: Remember to turn off the debug logging you simply have to change your scoped application's logging.verbosity property to "db".
There you have it! Some cool techniques for logging, and some examples of Scoped logging and testing. I REALLY like that I can model my code for my Script Include inside of the Studio using Fix Scripts!
Obviously there are a bunch of variations on everything I have presented here, but my idea was to show you a few of them to give you ideas on what can be done.
Go! Take it to the next level!
Steven Bell
For a list of all of my articles: Community Code Snippets: Articles List to Date
Please Share, Like, Bookmark, Mark Helpful, or Comment this blog if you've found it helpful or insightful.
Also, if you are not already, I would like to encourage you to become a member of our blog!
You must be a registered user to add a comment. If you've already registered, sign in. Otherwise, register and sign in.

