How to add drill‑down behavior to a pie chart visualization in UI Builder (Workspace)?
- Mark as New
- Bookmark
- Subscribe
- Mute
- Subscribe to RSS Feed
- Permalink
- Report Inappropriate Content
04-06-2026 09:07 AM
Note: I cannot see the option 'Link to Destination'
- Mark as New
- Bookmark
- Subscribe
- Mute
- Subscribe to RSS Feed
- Permalink
- Report Inappropriate Content
04-06-2026 09:21 AM
Hi @Niha2
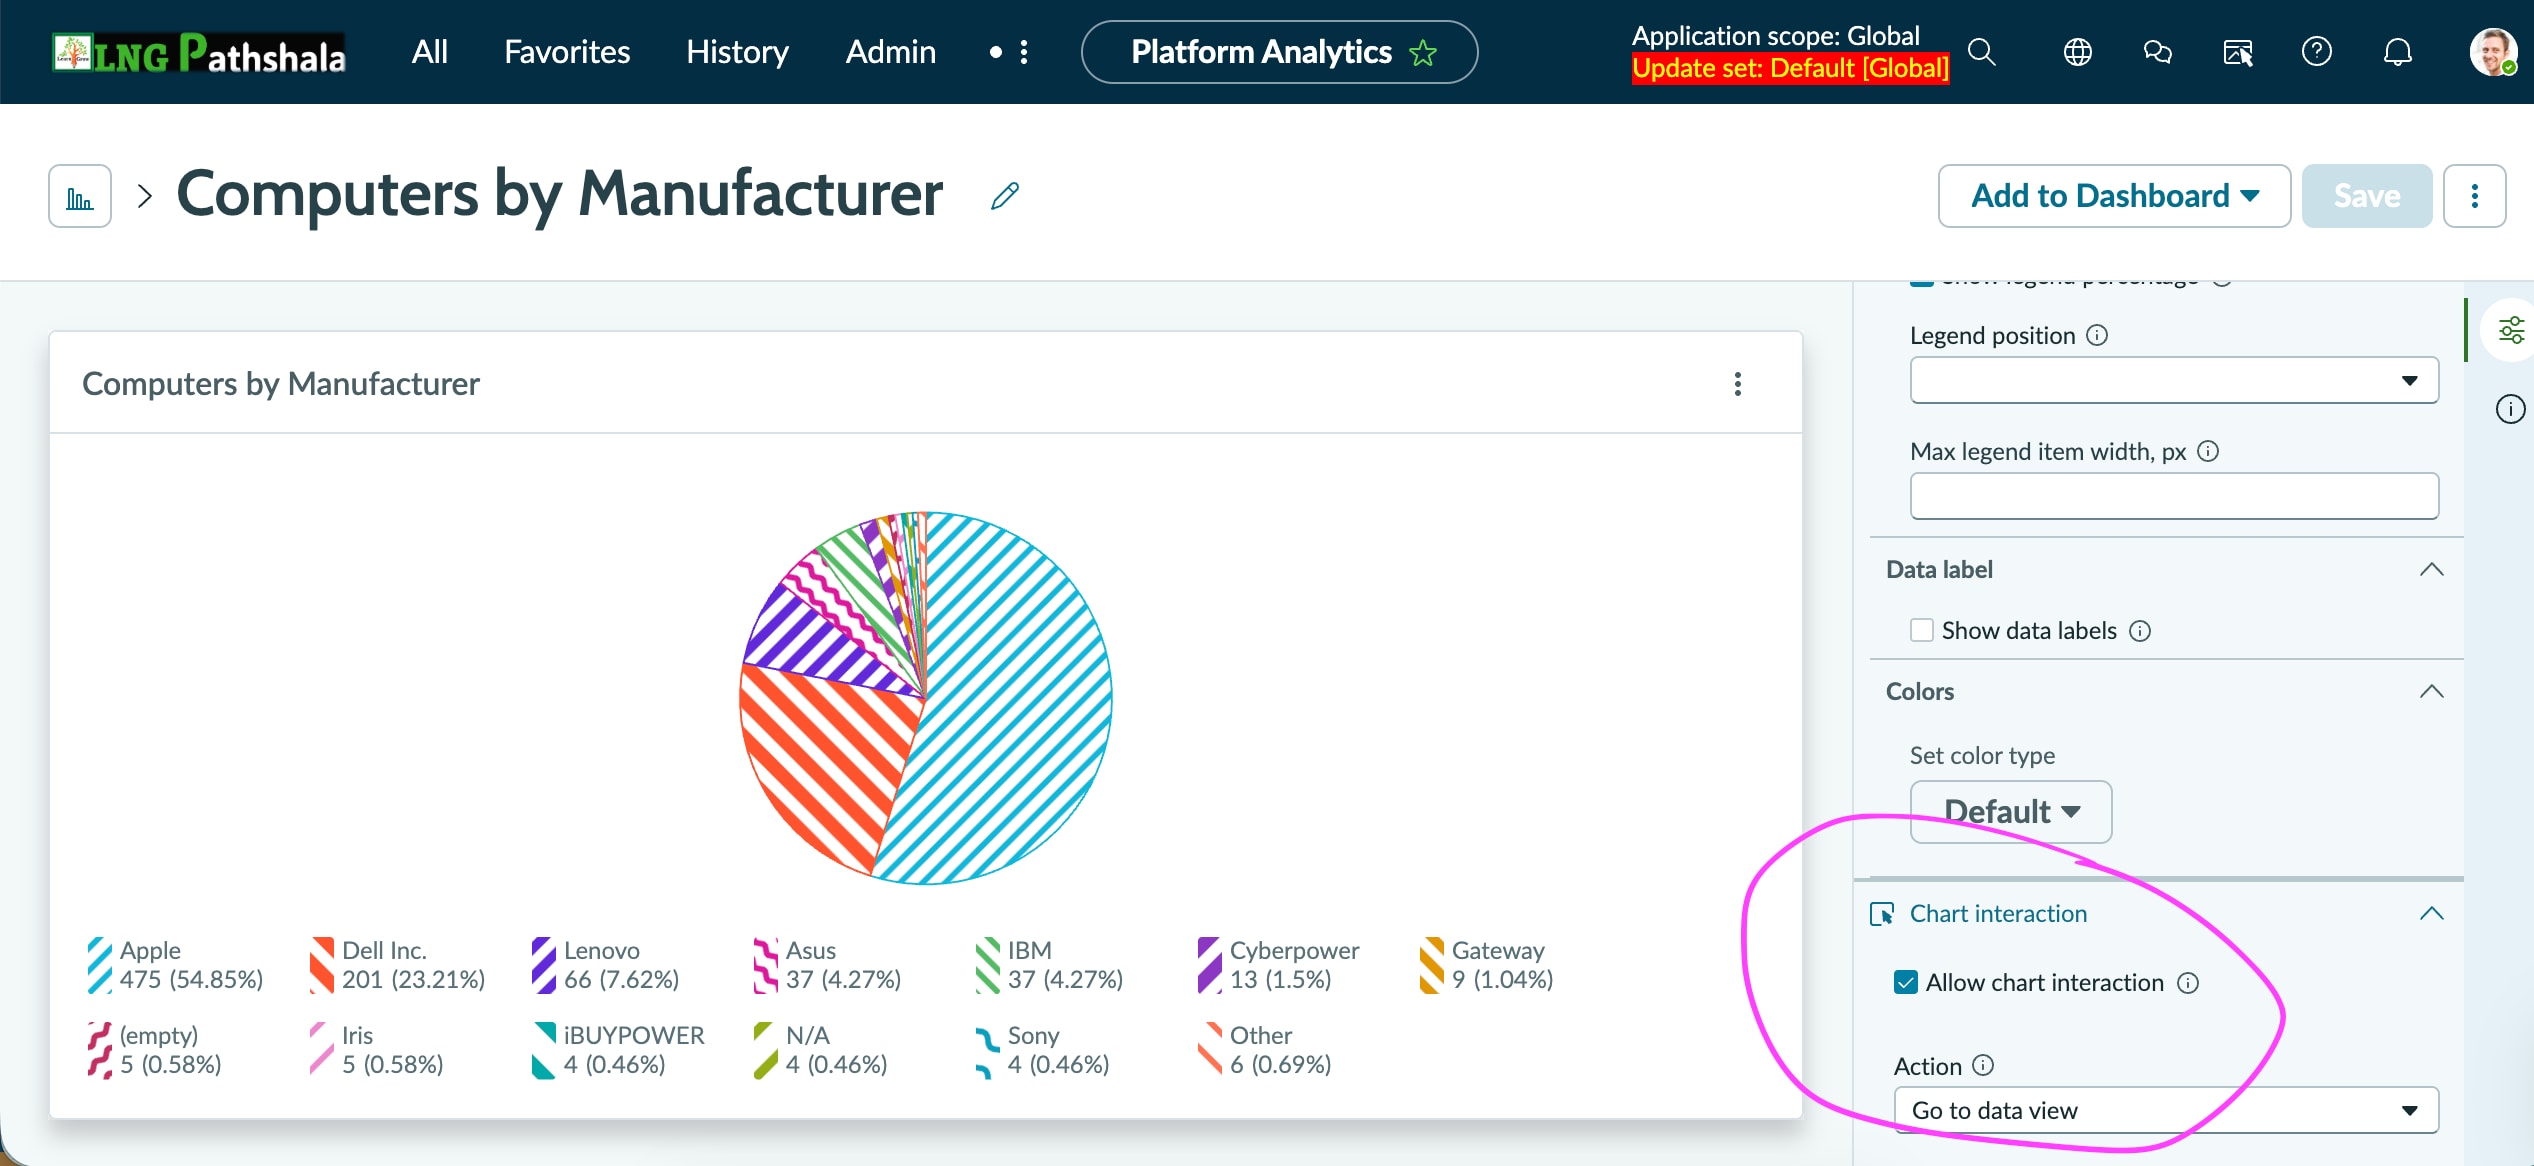
Out of the box, when a user clicks on any slice of a pie chart, it opens the record in a new page. Have a look at the screenshot to configure the same.
Regards
Dr. Atul G. - Learn N Grow Together
ServiceNow Techno - Functional Trainer
LinkedIn: https://www.linkedin.com/in/dratulgrover
YouTube: https://www.youtube.com/@LearnNGrowTogetherwithAtulG
****************************************************************************************************************
- Mark as New
- Bookmark
- Subscribe
- Mute
- Subscribe to RSS Feed
- Permalink
- Report Inappropriate Content
04-06-2026 09:27 AM
I should have been clear.
This is for data visualization component and I have enable drilldown option but not sure how would I bind it ?

- Mark as New
- Bookmark
- Subscribe
- Mute
- Subscribe to RSS Feed
- Permalink
- Report Inappropriate Content
04-06-2026 09:33 AM
I checked other community posts and cannot see Advanced dashboards - Redirect event handler as well
- Mark as New
- Bookmark
- Subscribe
- Mute
- Subscribe to RSS Feed
- Permalink
- Report Inappropriate Content
04-06-2026 10:00 AM
Hi @Niha2
For Link to Destination , Check the screen shot, given in this post :
Also refer: Multiple Drill-Down Level Reports in UI Builder
https://www.youtube.com/watch?v=7tfzbSp8XCk
https://www.youtube.com/watch?v=FQXrSCSOnLg&t=1148s
Regards
Tanushree Maiti
ServiceNow Technical Architect
LinkedIn: https://www.linkedin.com/in/tanushreemaiti