How to Display Target Values and Color Coding in a PA Dashboard Widget
- Mark as New
- Bookmark
- Subscribe
- Mute
- Subscribe to RSS Feed
- Permalink
- Report Inappropriate Content
02-05-2025 11:20 PM
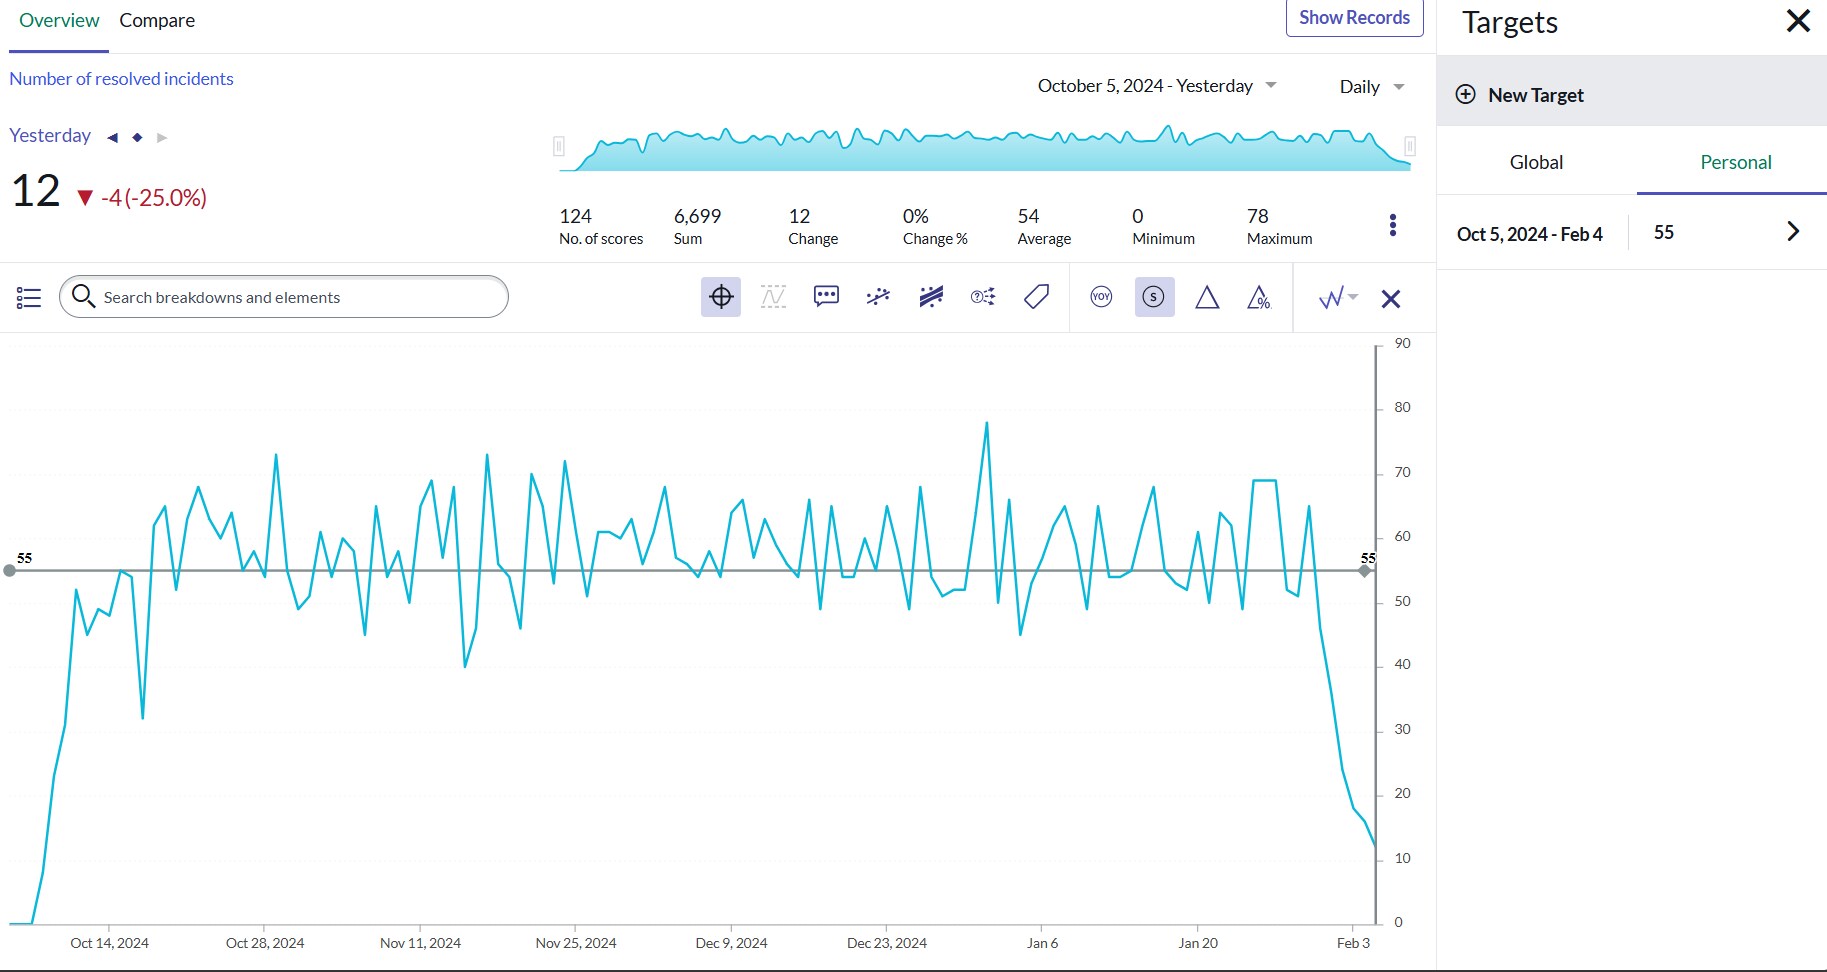
I've added a target for my indicator and can see it in Analytics Hub. However, I'm having trouble displaying the same target and color coding on my Performance Analytics (PA) dashboard widget. I've created a score type widget
Also i want to show different colors based on the target value: green if the target is below 90, yellow if below 70, and red if below 50.
Could someone please guide me on how to achieve this?
Thanks in advance!
.png)
- Mark as New
- Bookmark
- Subscribe
- Mute
- Subscribe to RSS Feed
- Permalink
- Report Inappropriate Content
08-11-2025 05:41 PM
Hi - Did you ever find a solution to this?
- Mark as New
- Bookmark
- Subscribe
- Mute
- Subscribe to RSS Feed
- Permalink
- Report Inappropriate Content
08-11-2025 07:49 PM
Hi @sunilsargam
May this help you
This helps other users find accurate and useful information more easily
- Mark as New
- Bookmark
- Subscribe
- Mute
- Subscribe to RSS Feed
- Permalink
- Report Inappropriate Content
08-12-2025 08:19 AM
Thanks Rafael for the link. Displaying the target line works (widget and analytics hub view) but the text value is not displaying on the widget view and only in analytics hub. That's the current challenge, not sure if there is a way to.