- Mark as New
- Bookmark
- Subscribe
- Mute
- Subscribe to RSS Feed
- Permalink
- Report Inappropriate Content
12-25-2014 06:29 PM
Hi community,
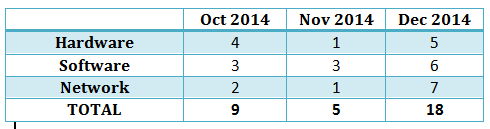
Has anyone create report of Incident Category by Month in a Pivot Table format such as followed?:

I cannot seems to find the right field to group it by months. Anyone has any ideas?
Thank you.
Solved! Go to Solution.
- Labels:
-
Analytics and Reports
- Mark as New
- Bookmark
- Subscribe
- Mute
- Subscribe to RSS Feed
- Permalink
- Report Inappropriate Content
12-26-2014 12:33 PM
Hi Alex,
As indicated by Anurag, pivot table reports only allow you to work with existing fields which means the whole date-time. That gives you a couple options in order of increasing difficulty:
- Use a Trend Chart as indicated by Anurag
- Create a month field and a business rule to populate it, you can make it readonly and not even show it on the form
- Create a custom report using a UI Page/UI Macro and GlideAggregate
- Mark as New
- Bookmark
- Subscribe
- Mute
- Subscribe to RSS Feed
- Permalink
- Report Inappropriate Content
03-30-2018 12:43 PM
With Explore Analytics you can do this easily from any pivot:

When you select a date-time field (e.g. "Created"), Explore Analytics allows you to group it by any part of the date-time:

You can also group them separately, like in this pivot comparing month over month by year:

It's all real-time and can be published to ServiceNow dashboards or elsewhere. You can try Explore Analytics for free for 30 days here, and a single user license for a year starts at $300/year.
- Mark as New
- Bookmark
- Subscribe
- Mute
- Subscribe to RSS Feed
- Permalink
- Report Inappropriate Content
01-03-2019 02:19 AM
Hi gyedwab,
I have a requirement to create similar kind of report, Could you please let me know step by step procedure in creating the above report.