


Marlos

ServiceNow Employee
Options
- Subscribe to RSS Feed
- Mark as New
- Mark as Read
- Bookmark
- Subscribe
- Printer Friendly Page
- Report Inappropriate Content
09-01-2017
01:16 PM
Service outages are often a result of changes made in application configuration. Starting with Jakarta, information on application configuration files can now be collected. This feature uses Horizontal discovery patterns to gather information on configuration files. Changes made to those files will be tracked and seen in the service timeline or in the CI timeline. This feature is useful in determining if changes in the configuration files affected application performance or led to a potential service outage. Since the configuration files are tracked for changes, the system administrator can easily check what changes were made and, after proper evaluation, revert part of these changes or fully roll them back in order to restore critical business services.
How does Configuration file tracking work?
Horizontal patterns offer an alternative to using probes and sensors to discover devices and applications in your infrastructure. Base system horizontal patterns define which configuration files are used by the application. A horizontal pattern included in the trigger probe of the process classifier will be launched during discovery to retrieve information about these files, such as file name and its content. The name and file content are then stored in the CMDB as CIs in the cmdb_ci_config_file_tracked table and can be used for tracking changes that happened at each discovery.
In many cases, problems that affect applications, outages, and incidents are somehow a result of changes made in the application configuration file. Before the Jakarta release, Service Mapping or horizontal discovery was able to detect changes in applications such as version, installation directory, or configuration filename. However, these attributes typically do not change frequently, or they may change only when the application is upgraded or not change at all. Changes that affect the business service may occur when modifications are made into the application configuration files when some parameters need to be set such as timeouts, port numbers, IPs, etc.
Starting in Jakarta, in order to mitigate the impact of these changes, the horizontal discovery patterns can now collect information from configuration files, including what changes were made in the files over time.
In Jakarta, the pattern designer can now be provided with the application configuration file information that needs to be tracked for changes.
For example, in the "MySQL" pattern below:
Discovery Patterns > My SQL server On Windows and Linux Pattern
There is a new tab called "Tracked Files":
In this section you define what files are important to your application and you want to track configuration changes for.
The definition can be based on attributes that are collected by the pattern itself (for example, $config_file).
The other thing you can also define is whether you would like to save the content of the file itself. This is important because in some cases the configuration file is in binary format or contains passwords that you don't want to disclose.
Before you run a horizontal discovery, make sure that the proper process classifier for your application is configured. In this example, the MySQL Server process classifier triggers the launch of the "My SQL server On Windows and Linux Pattern" Horizontal Pattern Probe:
Discovery Definition > CI Classification > Processes
Find the "MySQL Server" process classifier and make sure that the horizontal pattern probe is active:
Once you define this and the horizontal pattern runs, the system will create a CI per each configuration file tracked and this CI will be related to its parent application via contains relation.
You can see the tracked configuration file from several places as illustrated below:
Service Mapping > Business Services > View map
Select the MySQL Server icon, and on the right-hand pane click the link under Tracked Configuration Files. This will drill into the configuration file content.
If we click on Detailed Properties, we can also gather the same information by looking at the application form. Under Related Items look up for Tracked Configuration files under [Contains] relation:
This drills into the configuration file form again. In this form under Related Links, we can also track the versions for each change that occurred in the configuration file. This history file is maintained by using the sys_history table just like others CIs. As usual we can compare different versions of configuration files we are tracking. Changes in the file content are audited and can be compared. File content is stored in the CMDB.
As seen from the example above, the general-log parameter was changed from 0 to 1, thus enabling the MySQL general query log and potentially cause performance issues on the MySQL server.
You can also run a comparison to some point in time by clicking the expand button in the Business Service map and dragging the timeline as shown below:
Then from the right-hand pane, click in the updated file link to drill into the file content page.
Create a custom horizontal pattern to track configuration file changes
As mentioned, in order to track configuration file changes a horizontal discovery needs to be run first. A horizontal pattern probe that gathers information on the configuration file must be included in the trigger probe. Configuration file tracking is not available for discoveries performed by traditional probes and sensors. If the horizontal pattern is not defined or enabled and you run Service Mapping discovery, then the tracked configuration link will not show up:
In this case you need to create a horizontal pattern to collect the tracked configuration file information. In the example above we can check whether the trigger probe in the process classifier contains a horizontal pattern for Weblogic:
Discovery Definition > Processes > Weblogic Server
As we can see, a horizontal probe is not available by default so we need to create one.
Pattern Designer > Discovery Patterns > Weblogic
Create a new identification section called Identification for horizontal discovery.
Save the form and click on the newly created identification section to add the pattern identification steps. This pattern needs to identify the location of the Weblogic configuration file. Make sure you select Horizontal in Debug Type when editing the pattern. After you create the pattern, click on the setting indicated below to include the "Tracked Configuration File" CI. Make sure Debug Mode is disabled to enable this feature. Save the pattern. Once you complete, the right pane should look like this:
Go back to the process classification for Weblogic Server, Related Links, Trigger Probes > Edit. Under Collection, search for "Horizontal Pattern" and move it to the slushbucket on right and click Save. Now that the horizontal pattern probe has been added, double-click on the Pattern field for the horizontal pattern probe and search/add the Weblogic pattern. The Trigger probes list should look like this:
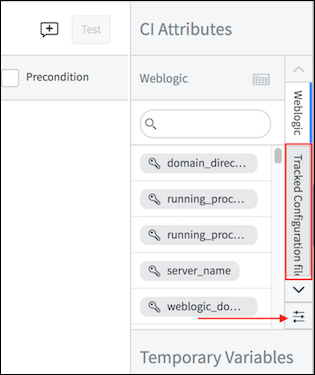
Save the form and return to the Weblogic pattern page. You will notice that "Tracked Files" tab has been added. Create a new entry to specify the File Path field. The $config_file is the variable we defined in the pattern steps that tells us the configuration file path. When you are done, click Save and Publish so that the pattern becomes available for use.
Run a horizontal discovery. The ECC input should contain the configuration file name we are going to track for changes:
Next, load the Business Service map and the tracked configuration file should now be available:
Troubleshooting configuration file tracking
You can troubleshoot the tracked configuration feature by navigating to Pattern Designer > Discovery Pattern Log.
There is an extra step called "File Tracking" under the identification section as shown below. This not really a step in the pattern but it shows the commands used in order to track the configuration files:
Configuration file tracking flags
Configuration parameters are predefined that control the limits applied to this feature.
System Properties:
| Property | Description | Default value |
|---|---|---|
glide.discovery.enable_file_tracking | Enable configuration file tracking as part of the Pattern based Horizontal Discovery | true |
glide.discovery.file_tracking.change_limit_count | Number of changes allowed on a tracked configuration file in the defined time window | 4 |
glide.discovery.file_tracking.change_limit_days | Time window in days for limiting the number changes on a tracked configuration file | 7 |
glide.discovery.file_tracking.max_files_per_ci | Maximal number of tracked configuration files per CI | 50 |
glide.discovery.file_tracking.max_file_size | Maximal file size for tracked configuration file content (B) | 500000 |
glide.discovery.file_tracking.min_file_size_for_simplified_comparison | Minimal file size for comparison by file size and last modification time instead of content (B) | 50000 |
glide.discovery.file_tracking.top_limit_max_file_size | Top limit for the max tracking file size configuration (B) | 800000 |
By tracking configuration file changes, the ServiceNow instance acts as a repository of these files along with their change history information. This feature helps you to quickly evaluate the impact of configuration changes made to your mission-critical applications and aid in the restoration of the associated business services.
More information can be found in the product documentation:
Labels:
- 4,965 Views
You must be a registered user to add a comment. If you've already registered, sign in. Otherwise, register and sign in.

