


jasonsmith

ServiceNow Employee
Options
- Subscribe to RSS Feed
- Mark as New
- Mark as Read
- Bookmark
- Subscribe
- Printer Friendly Page
- Report Inappropriate Content
08-28-2022
10:18 AM
No time like the present to start testing new ITOM Health features that are present in Tokyo. There were quite a few store updates in August, so make sure your store apps are updated as you evaluate. More features and content are on the way in November.
Here are some August highlights:
Accelerated RCA
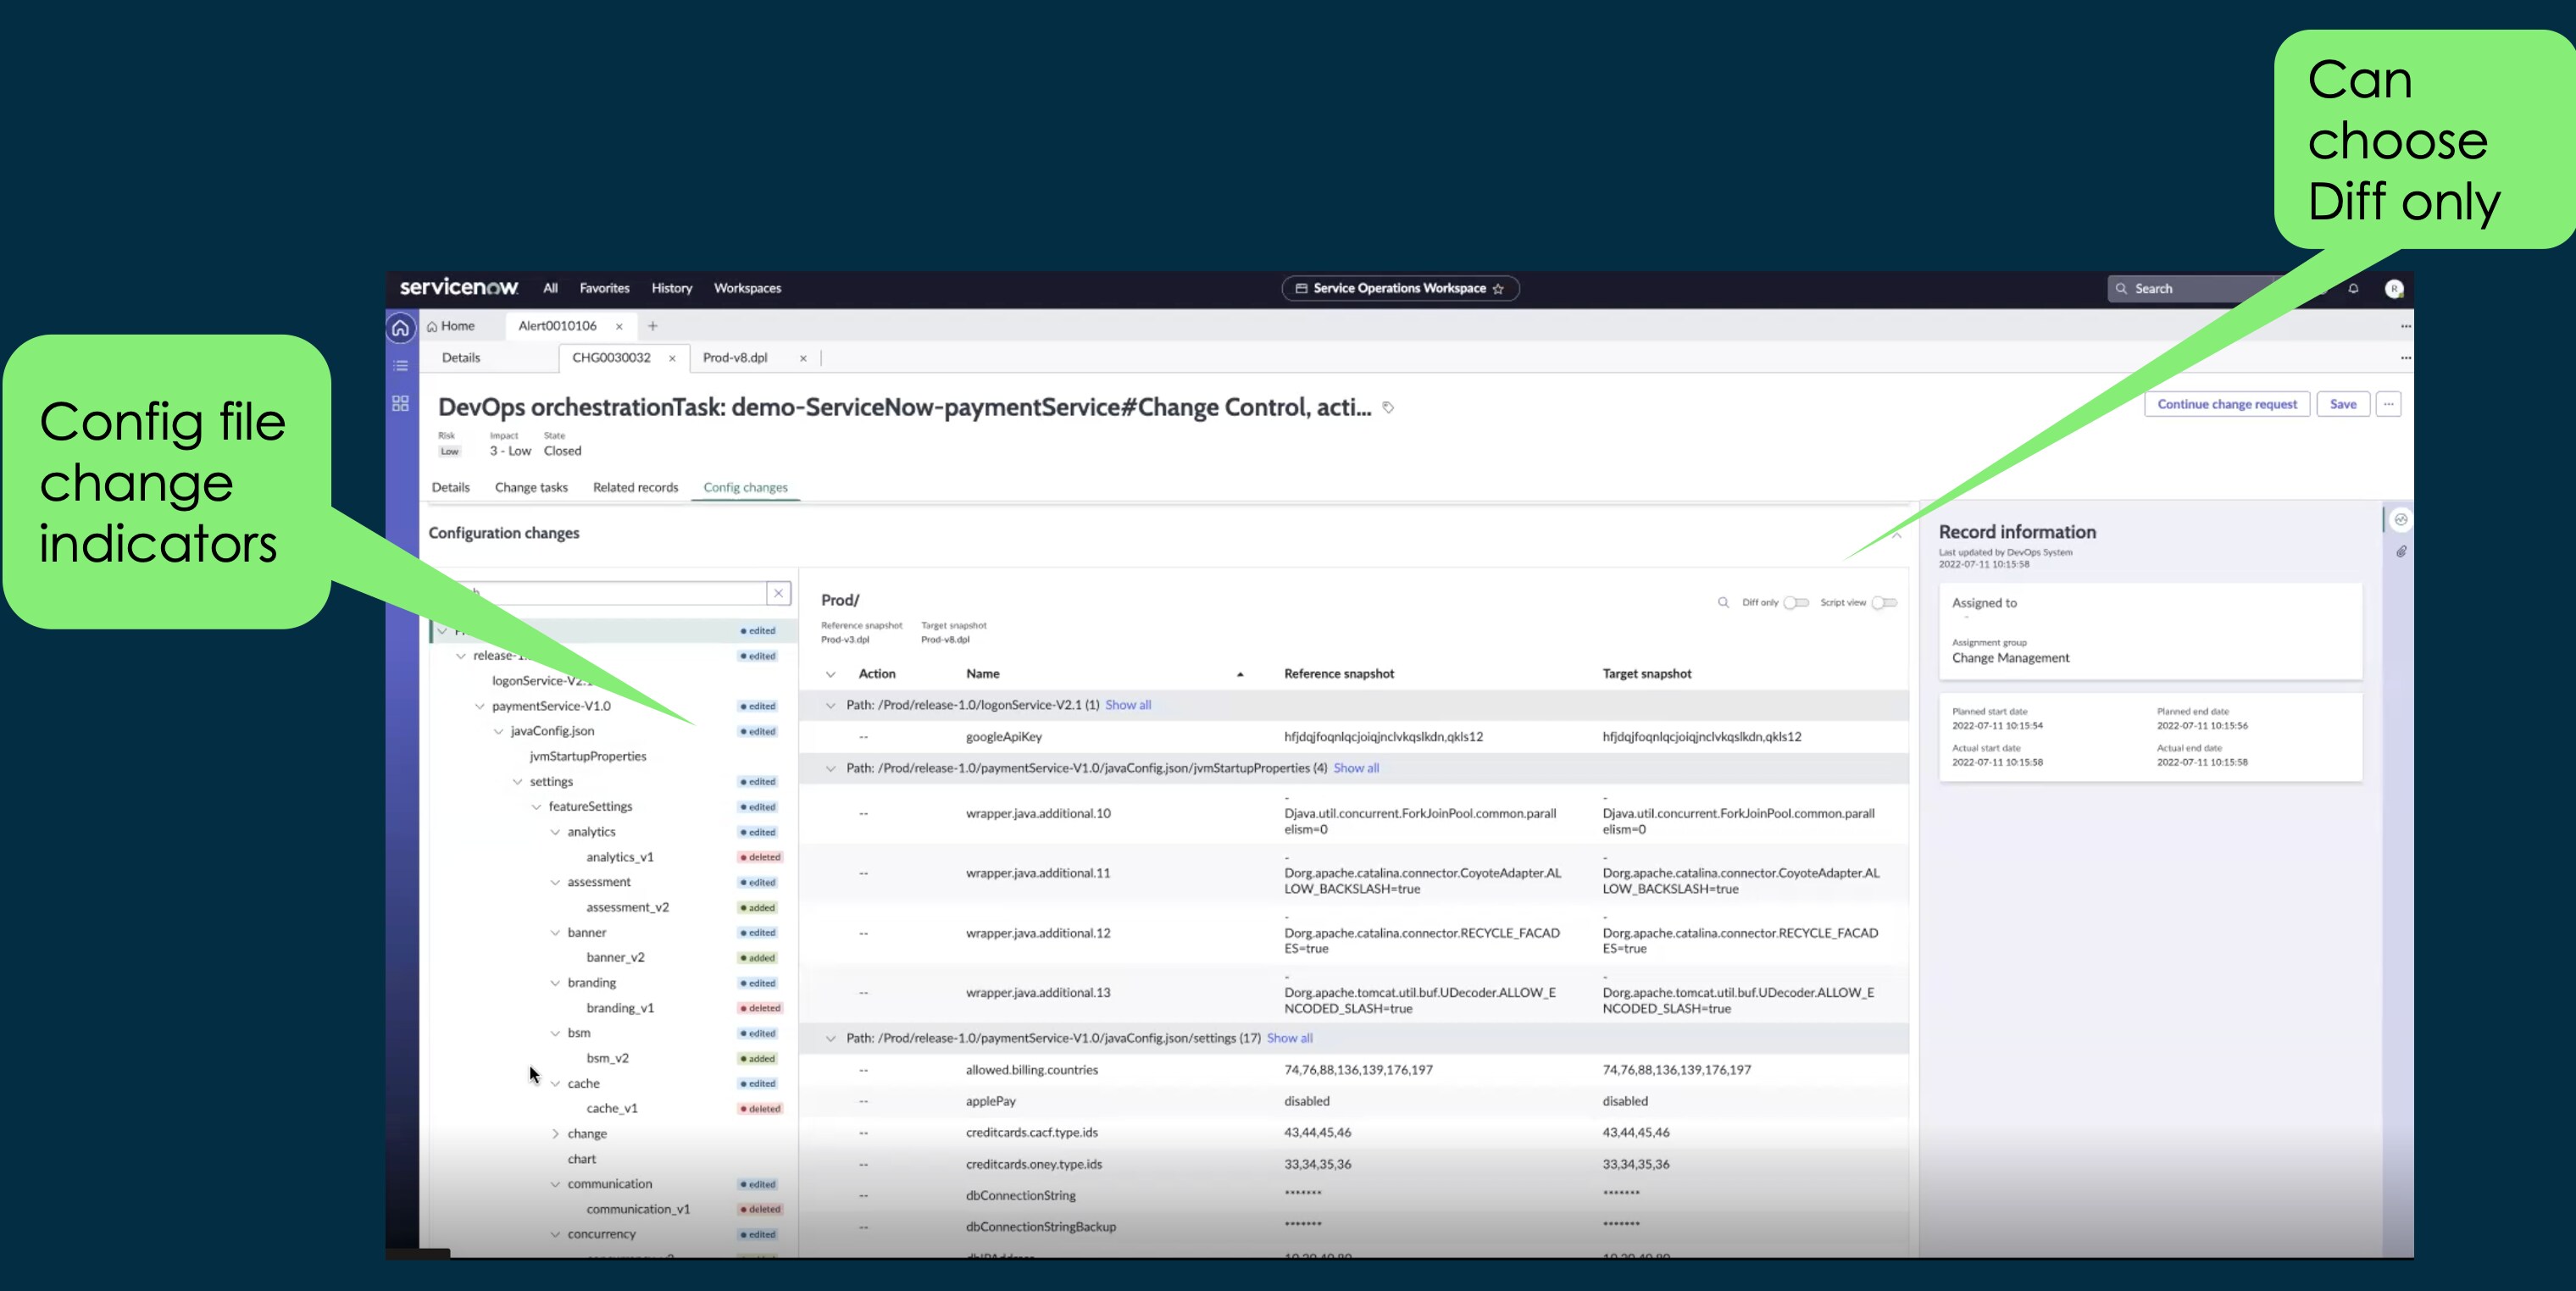
Probable Root Cause is executed by Event Management and uses 3 main sources of data: Alerts, Change Records and CI Topology. Accelerated RCA is an enhancement to this process and provides us with a new source of Change Records, a new source for configuration files and usability enhancements. It is the new DevOps Config app that is hooking into development pipelines to provide the new source of Change Records and associated configuration files. An associated usability enhancement allows you to compare and identify the difference between config file versions. Not only can you quickly identify configuration that negatively impacts service health, you can also see the configuration that was previously working fine. Clear cut case for addressing MTTR.
Bringing Service Portfolio to the Service Dashboard
In the Service Dashboard from within the Service Operations Workspace (SOW), you can now group by Service Portfolio in addition to Severity, Business Criticality, Location and Service Group. This provides for some interesting use cases like choosing the overarching business service to see which service offerings are currently impacted by service degradation. Service Offerings is what end users subscribe to, so it is easier than ever to prioritize based on customer impact.
In addition, there is a new tab on the Alert form that provides a list of Related Service Offerings which helps you understand overall impact even when you are woking a specific alert group.
HLA Dashboards
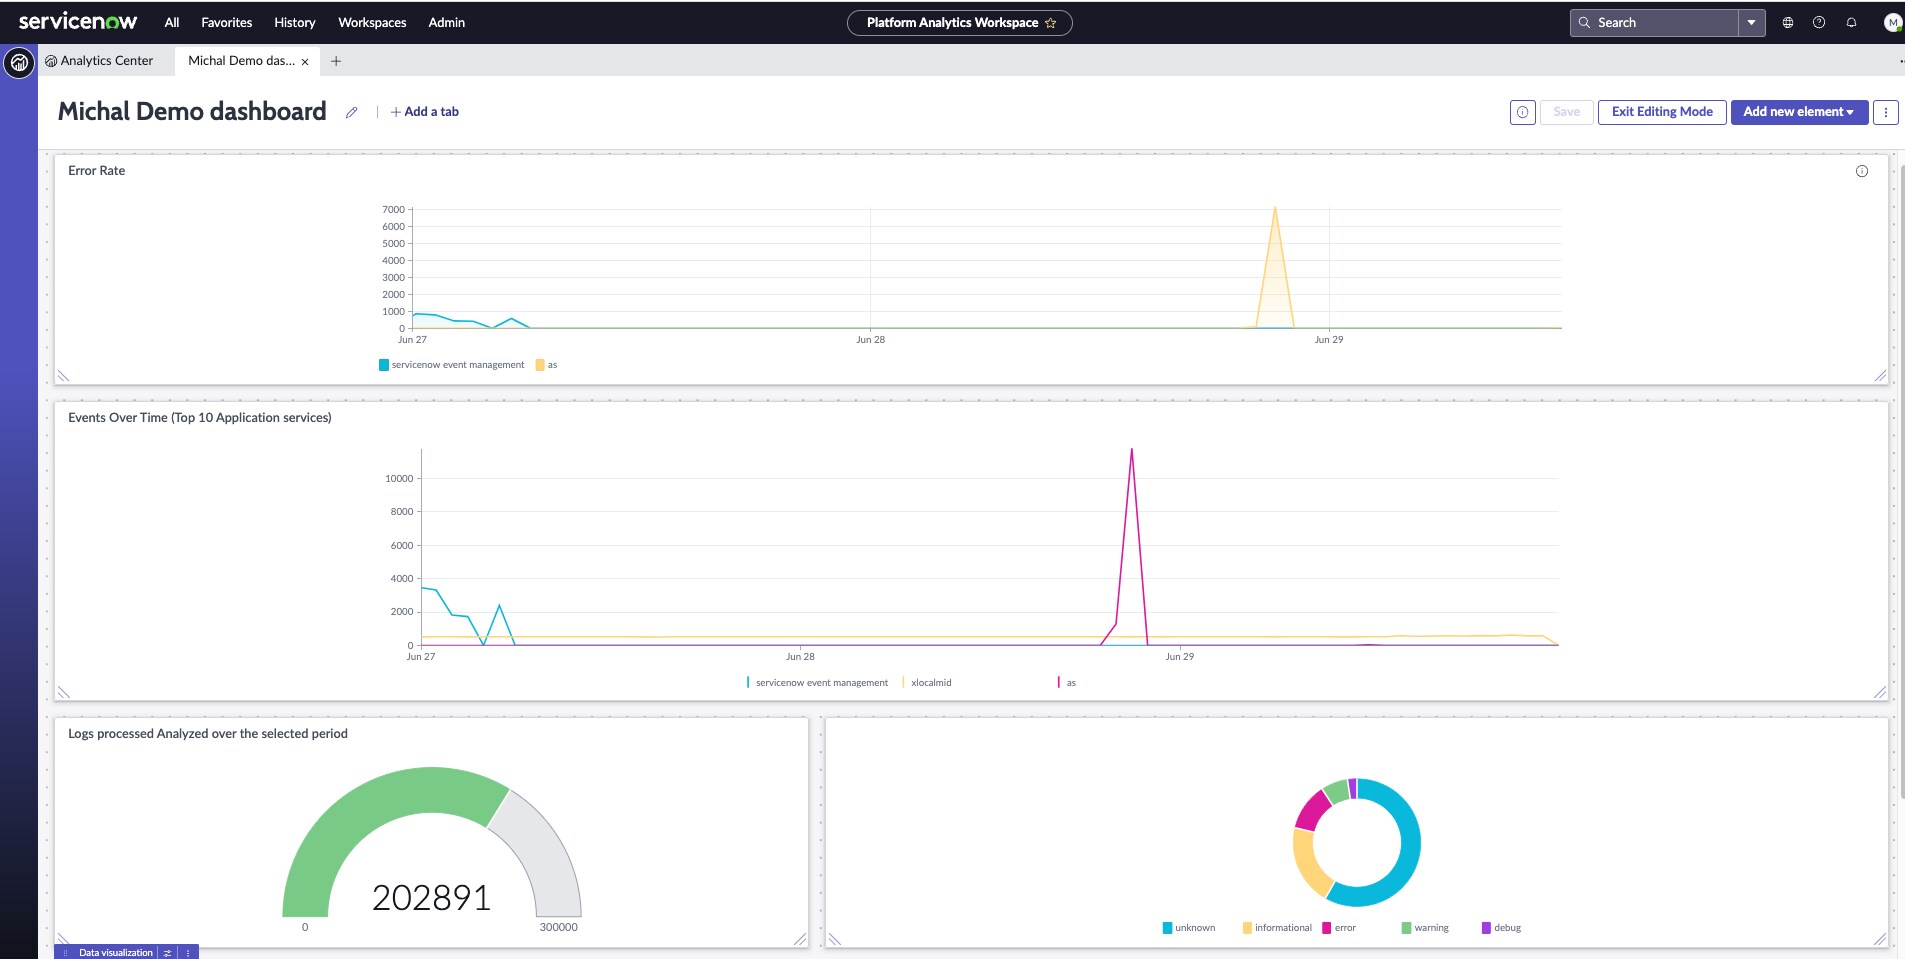
HLA shows up as a new data source that can be used in dashboards in the Analytics Center. You can turn HLA saved searches into valuable visualizations in addition to reporting on HLA components. These data visualizations can coexist on the same dashboard with visualizations using other platform data sources.
Multiple Event Management Rules Processing
Process and keep on processing event rules that are part of a chain is the name of the game. Actually, it's called "Apply additional matching rules" and additional matching Event Rules will be executed in the order of priority.
- Transform and compose is applied on previous Event Rule output.
- Threshold is disabled for rules that have the "Apply additional matching rules" checkbox ticked. You can still apply a threshold with the last rule in the chain.
- Last CI Binding wins - each binding setting is overwritten by the next Event Rule if it exists.
Metric Intelligence MAD Model
Metric Intelligence (MI) does times series explanatory data analysis to identify the best algorithmic fit for the actual time series data at hand. The Median Absolute Deviation Model (MAD) is applied when the time series is identified as inherently noisy and when the data aligns with Generalized Extreme Value Distribution. This ultimately reduces the risk that false positive anomaly alerts can be generated. Browse down on this page to read more about MI statistical models.
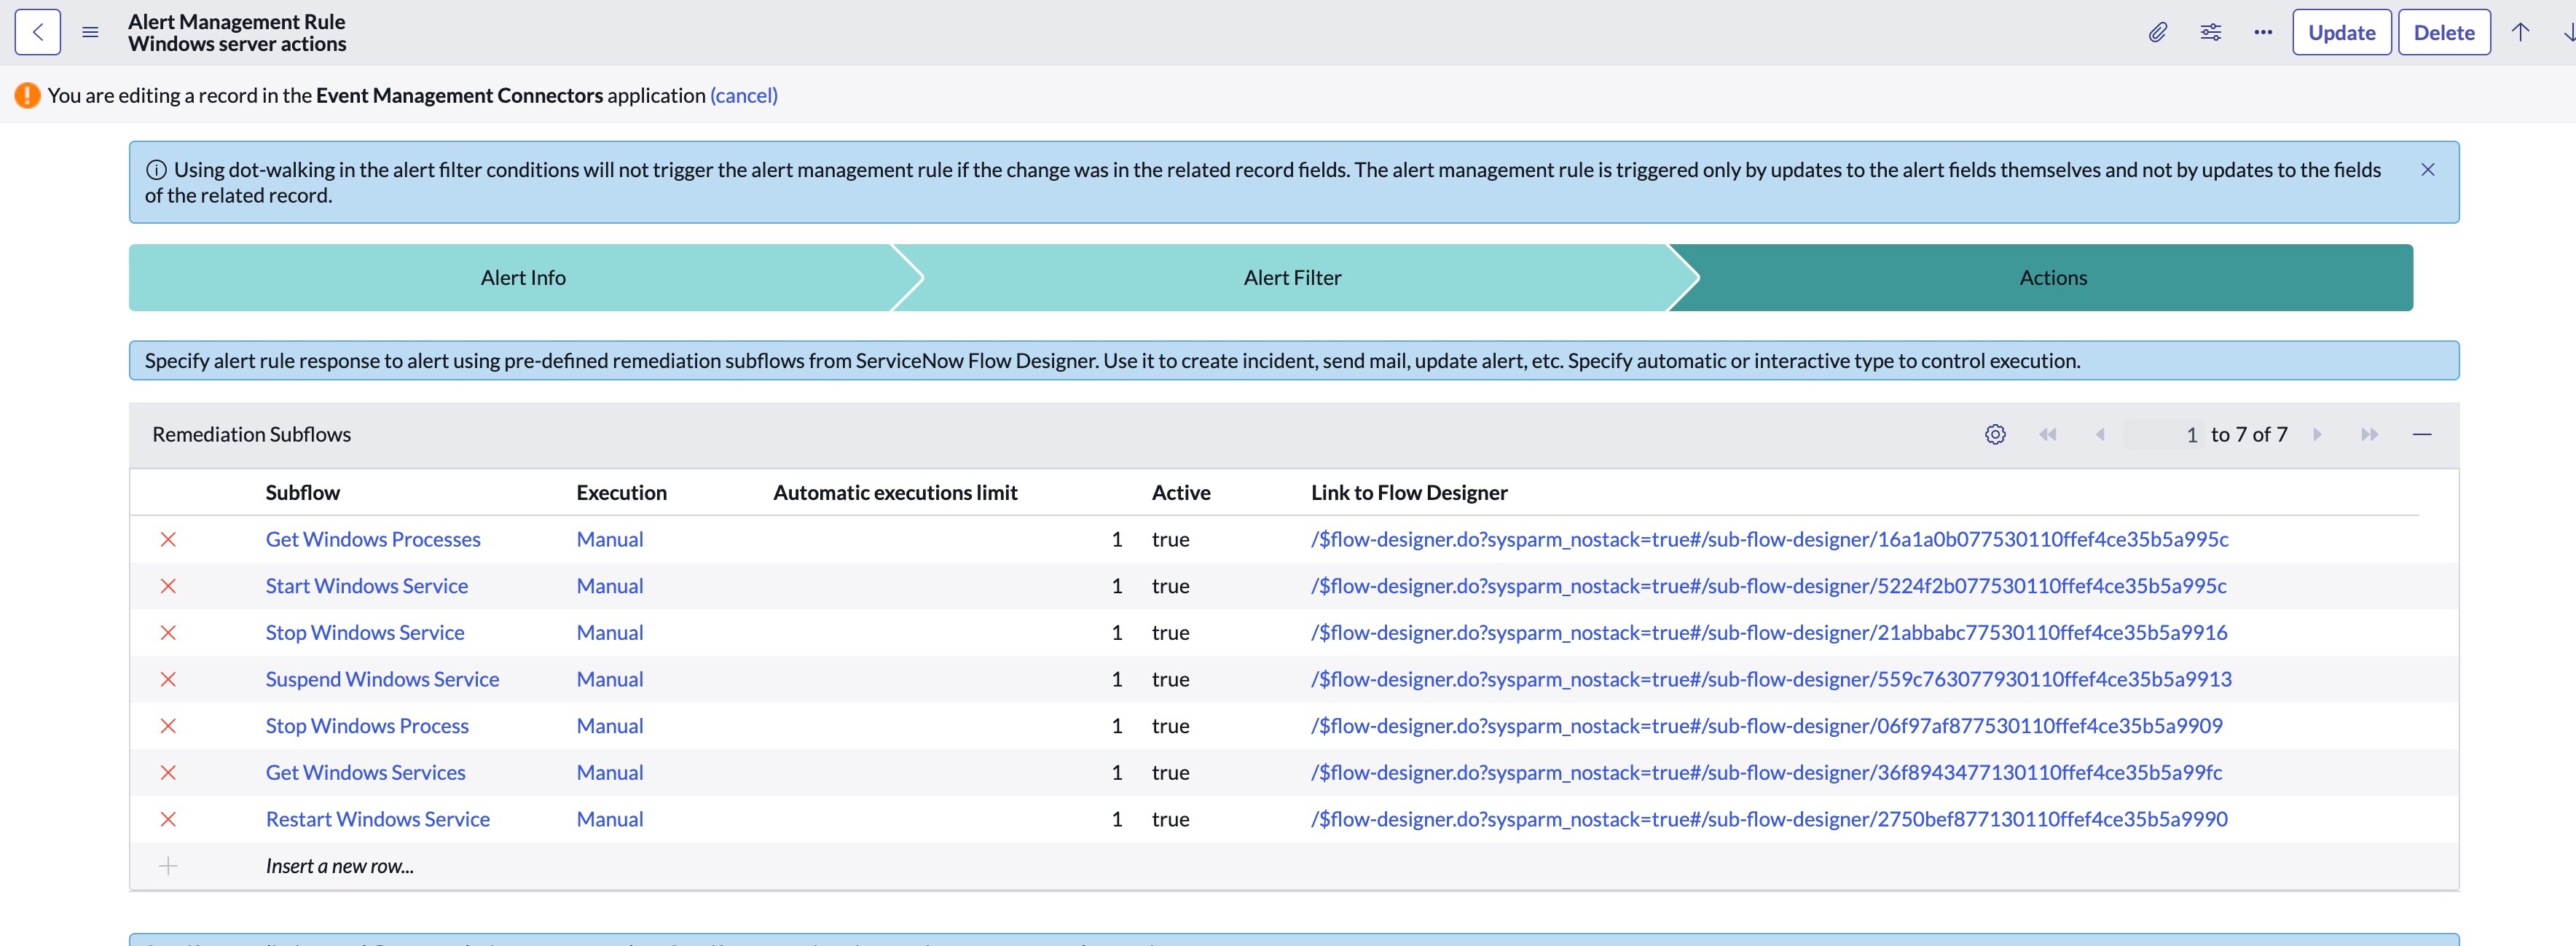
Remediation Actions using IH Spokes
The EM Connectors store app shipped remediation flows, actions and associated alert management rules in the August release. Auto-remediation is great; OOB auto-remediation flows is greater! This is in addition to OOB connectors for Scout APM, Honeycomb and Kafka.
Additional Content
Agent Client Collector Monitoring checks for HAProxy, GlassFish, Apache Kafka, Varnish, MSSQL and VMWare VSphere (datacenter, datastore, ESX and vm). See the release notes in the various store apps.
Links
DevOps Config
Health Log Analytics
Metric Intelligence
Service Operations Workspace ITOM Apps
Agent Client Collector Monitoring
Event Management Core
- 1,738 Views
You must be a registered user to add a comment. If you've already registered, sign in. Otherwise, register and sign in.

