metric data (Event Management)
- Mark as New
- Bookmark
- Subscribe
- Mute
- Subscribe to RSS Feed
- Permalink
- Report Inappropriate Content
12-13-2018 09:04 AM
Hi Anyone implemented event & Metric for any tool.
can you tell what is happening when we pull metric date via connector ?
- Labels:
-
Event Management
- Mark as New
- Bookmark
- Subscribe
- Mute
- Subscribe to RSS Feed
- Permalink
- Report Inappropriate Content
12-13-2018 12:21 PM
Hi there,
Metrics collection, analysis and anomaly detection are part of "Operational Intelligence".
When you configure a pull connector for metrics, the mid server will be able to fetch metrics from the datasource at regular intervals configured at the connector instance level. This data will be stored on a time-series database on the servicenow platform called MetricBase (this plugin must be enabled in order to use Operational Intelligence).
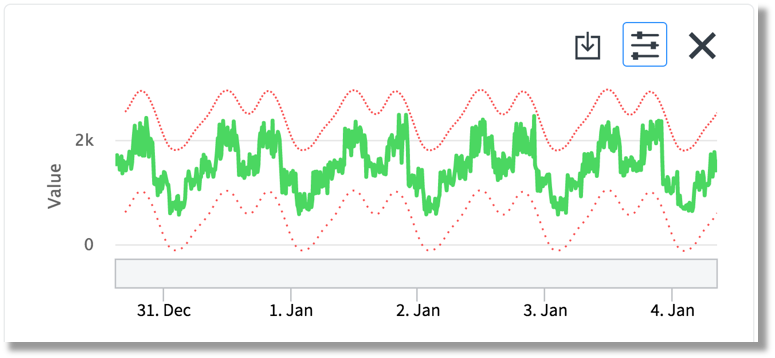
Data will be baselined so that "normal" behavior of every metric can be analysed and baselines used to understand when a value deviates from usual points at given point in times and generate anomalies when needed. Anomalies are special kind of alerts and have a confidence score that basically tells "how confident" the algorithm is that the value is anomalous.

In the picture above the colored line shows the anomaly score which went up to 9.012 in case of the anomaly shown there.
Anomalies can be promoted to alerts and used to proactively work on things that could become issues so you could potentially open an incident to fix things before the anomaly turns into an actual problem.
Example:
Observing a metric like response time, it will be possible to determine that it has normally a value of 0.5 seconds between midnight and 4 am, 1 second between 4am and 6am, 1.5 seconds between 6am and 9am, etc.
Now with a traditional approach:
- a static threshold would be used
- it would be set at the highest acceptable value, like 1.5
- this means that if at 2am a 1 second response time is measured then no alert would be generated even though that's twice the normal value at that point in time
Operational Intelligence can
- detect seasonal behaviors like the one described above
- so if a response time, a cpu load, the number of concurrent sessions of some application component should ever be significantly anomalous at a specific point in time an anomaly would be generated automatically.
- According to our example, by generating an anomaly when the metric (response time) is at 1 second at 2am (so still below out hypothetic 1.5 se static threshold) it show that the slower than usual response time could be a sign of a problem that could actually impact end users when it's "rush hour" and the most of the users are connected and experience unacceptably slow response times.

Pull connectors for metrics (like SCOM, Zabbix, AWS, Azure, Nagios, etc.) allow to feed OI with metrics from these tools and apply on those what described above. OI provides an agnostic approach meaning that the capabilities described above would apply to any metric ingested (OS capacity metrics, users, business KPI like number of orders placed in a system, number of new contracts in the last 10 minutes, etc.)
OI provides also visual tools like "Insights Explorer" (IE). IE allows to drag and drop metrics on a dashboard to visually correlate them and to easily share the findings with other users.
I hope this gives you a better understanding of what can be done when pulling metrics with connectors or pushing metrics directly into OI.
Gp
- Mark as New
- Bookmark
- Subscribe
- Mute
- Subscribe to RSS Feed
- Permalink
- Report Inappropriate Content
08-15-2024 10:35 AM
Hi @Gianpaolo Pagan,
well put the highlevel of OI and various features. I have fews questions with regarding to how this is happening behind scenes.
1. When a metric is received by mid web server is it forwarded to clotho (time series DB) or is it from the instance it gets forwarded?
2. Is there a table in the instance where metrics and their scores are stored? (I have explored "metric type", "metric to CI" and few other tables. On thing I have notices that there are additional fields in the list view of cmdb items for which we have metrics gathered. but that is just one number, where is the history stored?
3. What happens when i try to pull a time series chart (usually on the Analytics dashboard or Insights explorer) of a given metric? Is the data fetched from clotho db or populated from within the instance?