Operational Intelligence metric values not showing up anywhere
- Mark as New
- Bookmark
- Subscribe
- Mute
- Subscribe to RSS Feed
- Permalink
- Report Inappropriate Content
08-06-2018 10:49 AM
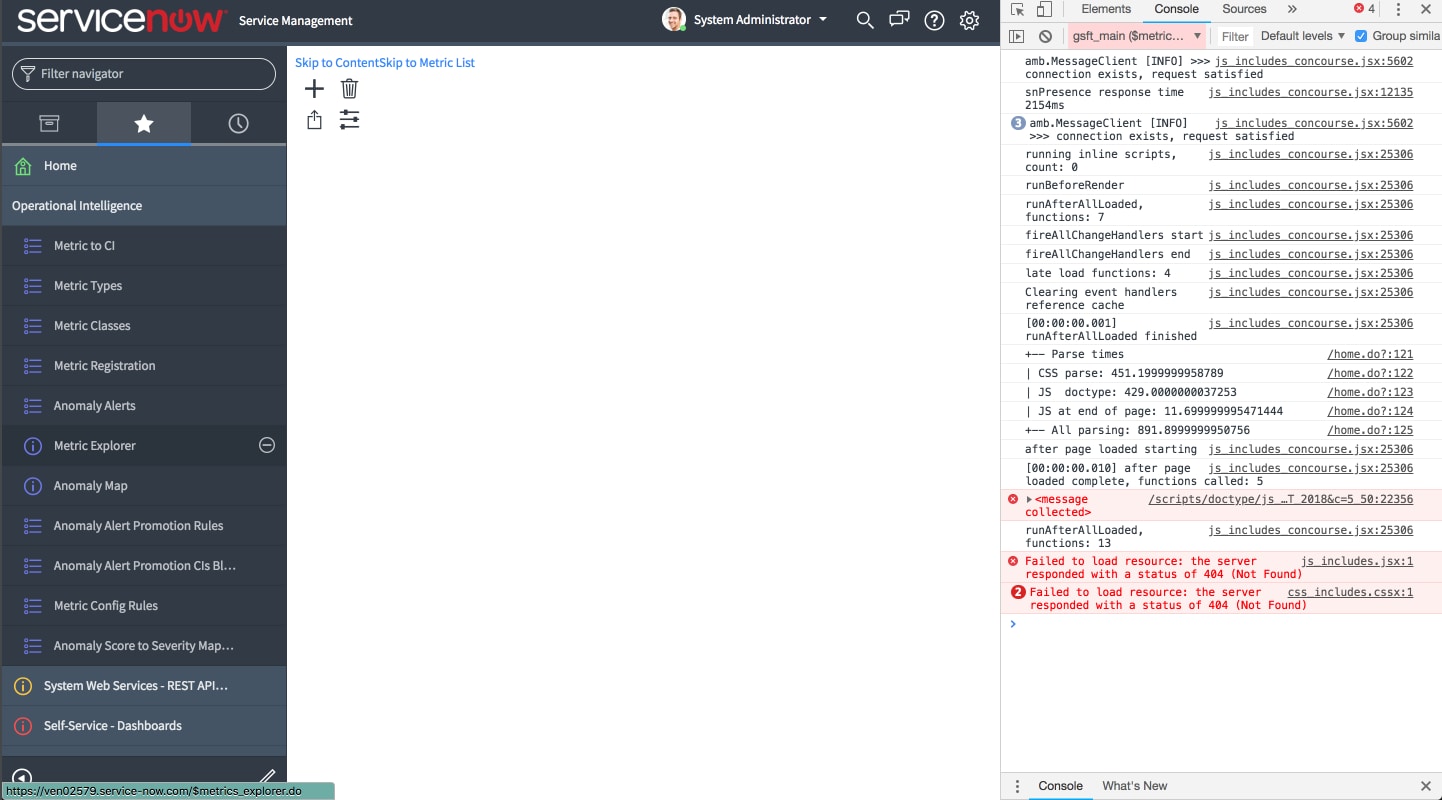
I'm working on an integration which pushes metrics to ServiceNow's Operational Intelligence. Currently, I am trying to get the sample found in https://docs.servicenow.com/bundle/kingston-it-operations-management/page/product/event-management/reference/mid-POST-metrics.html to work. I get a 200 response code when making the unaltered call with no response body, and it adds descriptions for the metrics that should be created to the `Metrics to CI` table and the `Metric Types` table, however I cannot find the value of the metric anywhere. I expected to see it in the `Metric Explorer`, however I don't see anything there and I get a 404 error(see screenshot). As a result, I'm unsure whether something in the call failed even though we got a 200 response with no errors and it created mappings or if I'm looking for the metric in the wrong place. I'd like to know where we should be expecting to see metrics.
I also have not been able to associate the metric_types that I create with specific custom CI Classes I have created. I have tried using Event Rules and Identification Inclusion rules to associate to the custom class if a specified custom required identifier is included, but this does not work. I'd like to know how to associate the metrics to the appropriate CI/CI Class.
Thanks!
404 Error when trying to view Metric Explorer:

- Labels:
-
Operational Intelligence
- Mark as New
- Bookmark
- Subscribe
- Mute
- Subscribe to RSS Feed
- Permalink
- Report Inappropriate Content
08-09-2018 11:35 PM
Hi Katherine,
Did you find records created in `Metrics to CI` table (sa_metric_map) and the `Metric Types` table (sa_source_metric_type)?
Regardless of what happened in above tables, I don't expect "Metric Explorer" return 404. Did "Metric Explorer" ever work?
Regards,
Kar Meng
- Mark as New
- Bookmark
- Subscribe
- Mute
- Subscribe to RSS Feed
- Permalink
- Report Inappropriate Content
04-29-2019 08:50 AM
Note sure whether you resolved your issue, but the first thing to check is whether you have MetricBase installed on your instance. Although metrics can be sent successfully to the MID Server so you see the 200 response code, the MID Server then streams the metric data to the MetricBase time series database on your ServiceNow instance. MetricBase is not available by default - you need to be licensed to use it (e.g. you have Operational Intelligence licenses) and will need to raise a HI request to have the plugin activated and MetricBase provisioned.
In the Madrid release (I recommend upgrading to this release for Operational Intelligence), you use Event Rules to map metrics to specific CIs. You can read about it here.
Once MetricBase is available and you have an Event Rule correctly configured you should see metrics for CIs in Insights Explorer (formerly Metric Explorer).