Normal garbage collection trend?
- Mark as New
- Bookmark
- Subscribe
- Mute
- Subscribe to RSS Feed
- Permalink
- Report Inappropriate Content
09-28-2015 08:57 AM
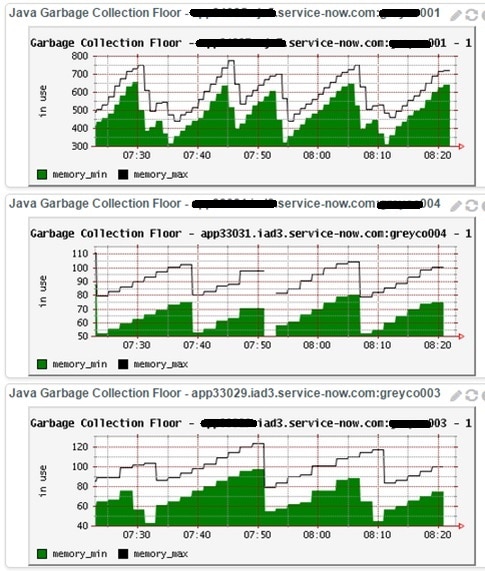
Hello, While reading logs this morning I decided to view the garbage collection activity on our production instance. While reading up on how to decipher it, I noticed that our trended activity closely matches that of the example of problematic usage as noted on the wiki page.
ServiceNow KB: Identifying abnormal JVM memory utilization (KB0517274)
I've attached two screenshots to this question. The first (3 histograms) depicts our production instance and the second images is the example. If anyone has any input, I'd greatly appreciate hearing from you.


Thanks!
- Mark as New
- Bookmark
- Subscribe
- Mute
- Subscribe to RSS Feed
- Permalink
- Report Inappropriate Content
09-30-2015 12:40 PM
Tom,
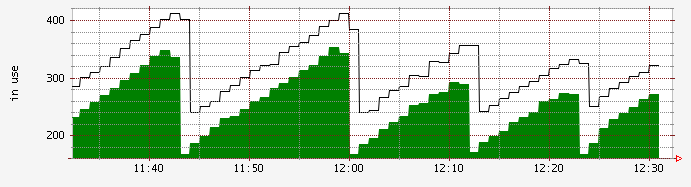
The image on the wiki showing a "good" graph is over the course of 1 day, your graph is over the course of 1 hour. Since the garbage collector runs periodically (every 10-20 minutes), it is normal to see the saw-tooth shaped graph when looking at a very short time period.
The wiki's "bad" example is showing the garbage collection floor growing over the course of several days. The saw-tooth shape over the course of many hours or days is something to be more concerned about.
Here is an example from my instance (it isn't used much, so there is not any heavy memory usage).
1 day:

1 hour:

You can see when the garbage collector runs by going to the system log and filtering for messages that start with "After GC"
your-instance/syslog_list.do?sysparm_query=messageSTARTSWITHAfter%20GC%5Esys_created_onONThis%20week%40javascript%3Ags.beginningOfThisWeek()%40javascript%3Ags.endOfThisWeek()
Thanks
Brian