- Mark as New
- Bookmark
- Subscribe
- Mute
- Subscribe to RSS Feed
- Permalink
- Report Inappropriate Content
01-08-2025 08:53 AM - edited 01-16-2025 08:45 AM
Has anyone else experienced an issue with the filter in the Service Operations Workspace's Service Dashboard module?
When I click on the Service Dashboard and then the funnel icon, the Filter Services box takes about 15 seconds to load. After that, I select my filter, click Apply, and the box remains open for a long time.
When I click the timer button below the X, I see the following response times: Response Time: 261 ms, Network: 96 ms, Server: 79 ms, and Browser: 86 ms.
Nothing happens for a while, and I eventually have to click the X to close the box. To view my selected filter, I need to refresh the browser. Is this the expected behavior?
I'm currently using Xanadu Patch 4 and Google Chrome.
Thanks for your time!
UPDATE: I've opened a case with ServiceNow HI. They've created a Problem for the issue.
Solved! Go to Solution.
- Labels:
-
Service Operations Workspace
- Mark as New
- Bookmark
- Subscribe
- Mute
- Subscribe to RSS Feed
- Permalink
- Report Inappropriate Content
01-28-2025 05:32 AM
- Mark as New
- Bookmark
- Subscribe
- Mute
- Subscribe to RSS Feed
- Permalink
- Report Inappropriate Content
01-09-2025 06:07 AM
Hi @nebula ,
Can you attach a screenshot please.
- Mark as New
- Bookmark
- Subscribe
- Mute
- Subscribe to RSS Feed
- Permalink
- Report Inappropriate Content
01-09-2025 07:45 AM
Hi @Community Alums - I actually tested in my PDI and the experience is identical. You have to X out of the box and refresh your browser to see the filter save. Not ideal UX imo, but it seems to be working as ServiceNow intended.
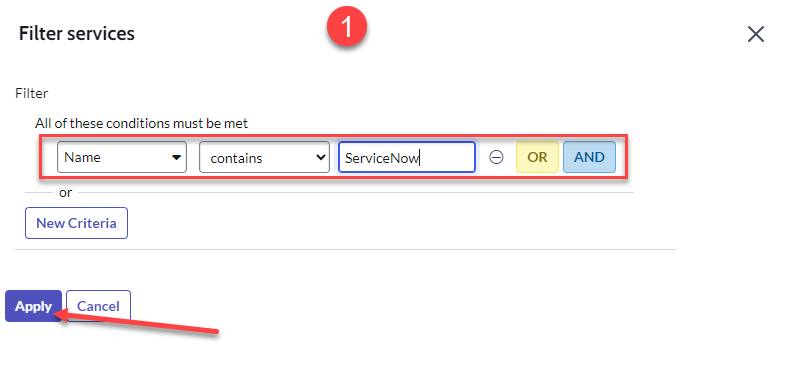
Image 1 - I selected my filter and clicked Apply.
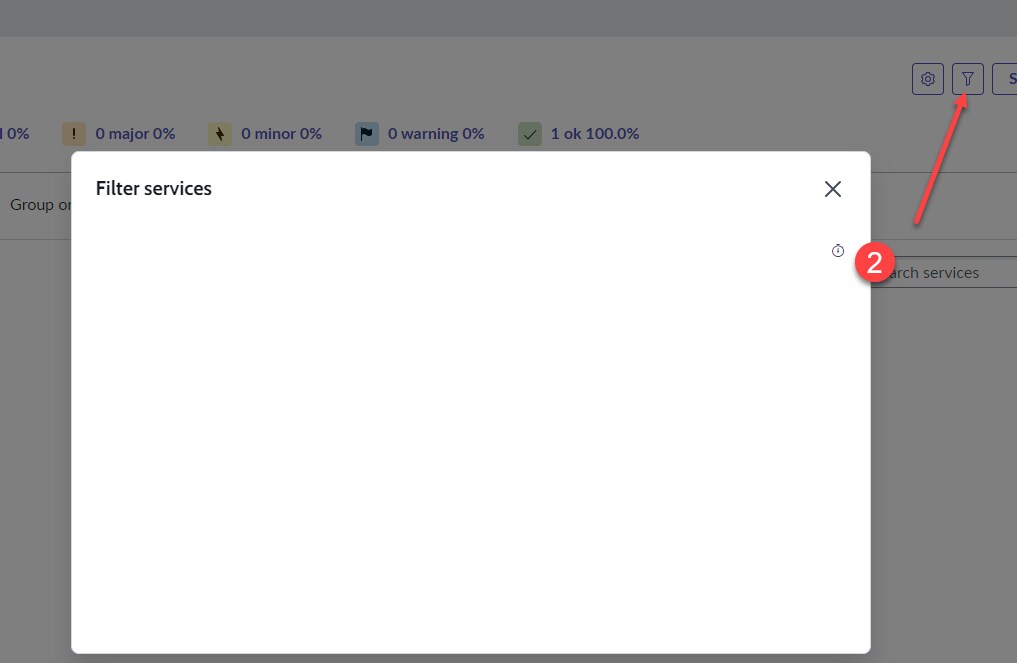
Image 2 - Box sits there until I X out. Note filter doesn't show a number.
Image 3 - After I refresh, Filter has a notification that a filter is selected.
- Mark as New
- Bookmark
- Subscribe
- Mute
- Subscribe to RSS Feed
- Permalink
- Report Inappropriate Content
01-09-2025 08:53 PM
HI @nebula ,
Thanks for the screenshots, really appreciate.
Well, i just tested on my PDI and Customer instances, it's the expected behaviour OOTB.
Unfortunately , we can't control that.
- Mark as New
- Bookmark
- Subscribe
- Mute
- Subscribe to RSS Feed
- Permalink
- Report Inappropriate Content
01-09-2025 09:09 PM
No, this is not the expected behavior. The filter in the Service Dashboard should apply without needing to refresh the browser. The delay and the need to manually close the filter suggest a potential performance or compatibility issue. Ensure your browser is up-to-date, clear the cache, and check for any pending updates or known issues with Xanadu Patch 4. If the problem persists, report it to support for further investigation.