Can we add two breakdowns elements?
- Mark as New
- Bookmark
- Subscribe
- Mute
- Subscribe to RSS Feed
- Permalink
- Report Inappropriate Content
12-15-2022 03:48 PM
Hi all,
I was wondering if we can sum up the value of two breakdown elements. I have a very specific case which I'm hoping you can help me out.
A bit of background: On the incident table we have the OOB Company field, however previous admin created a list type field to capture other companies impacted by the same incident (don't ask me why they did this). So, for example, I have scenarios where incident 1 has company X and other companies impacted as a list of A, B and C. As well as incident 2 with company A and other companies impacted as X.
And what I need is to get the total number of incidents each company was impacted, no matter if they were captured in the company field or in the list type field. Therefore, in the above example, company X would be 2, A - 2, B -1 and C - 1.
Now to my question: I was able to create two breakdowns, one mapping to the OOB Company field and the other mapping to the list type field.


I've added each breakdown to its own Indicator and both indicators have the same source which is Incidents.New.
As is to be expected the breakdown that is mapping to the list type field doesn't have the correct total, but I don't care about the total, I care about the score for each element of the breakdown.
So, the question is can we add elements together?
Below is an example of the results (I've cut out the rest of the list for simplicity). But as you can see the company on the second line on Oct 1st would have 4 as total, because they appeared 3 times in the Company field and 1 (once) on the list type field (other impacted). My goal was to sum these up, not the total at the top.


Is this possible? Or is this a complete farfetched idea? I would appreciate if you have any other ideas, but I understand that the data doesn't help with this weird list type field.
- Mark as New
- Bookmark
- Subscribe
- Mute
- Subscribe to RSS Feed
- Permalink
- Report Inappropriate Content
11-27-2023 08:26 AM
Hi Jefferson,
Firstly, you have some architecture you're having to deal with! And thanks for detailing the question, it helped a lot.
Now, yes, you can sum up the elements.
Here I see you have 5 companies, so you'll need to create 5 formula indicators, one for each company.
Now for the formula indicator for Company_2, in the formula field, press the "Browse for an Indicator" related link and in the pop up, add indicator 1, breakdown as company, and breakdown element as Company_2.

Add a plus sign and then add the second indicator for the second breakdown with breakdown element Company_2.
Eventually, your formula should look like:
[[Indicator 1 > Company = Company_2]] + [[Indicator 2 > Company = Company_2]]
Like this, have 5 indicators, with the only difference being the 2 breakdown elements, and you should be all set!
Hope this helps.
Best
Hasan
- Mark as New
- Bookmark
- Subscribe
- Mute
- Subscribe to RSS Feed
- Permalink
- Report Inappropriate Content
08-24-2025 06:08 AM
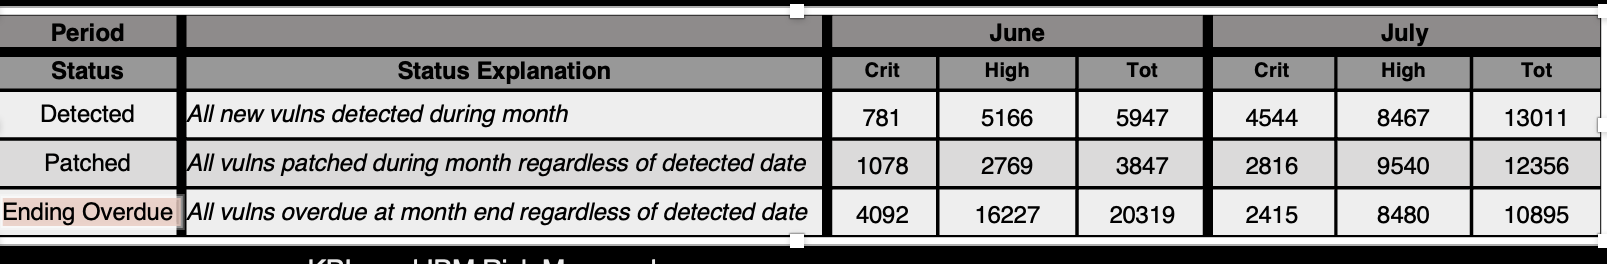
hello Hasan..I have something similar requirement. Attaching a screenshot.
As you see, in the rows we have detected,patched and Ending overdue. and columns as vulnerability count broken down by critical and high priority. let me keep the priority aside for now..
detected condition is created = this month or created - last month; patched condition is resolution date this month or last month..
now the conditions on each date field should be mutually exclusive, means condition on one date field should not have affect on other.
How do I accomplish this task? i am able to get the design for one month but unable to get the same view for 2-3 months..
My approach: created two breakdowns, one for detected ( when created date falls between firstday of lastmonth to firstday of next month then group under 'detected') similarly for patched..for me to get counts for latest two months on columns, I tried creating two indicators, one for current month and one for prior month and applying filters on dates (eg: created on this month, created on last month)..but created date filter condition is clashing with resolution date filter and giving wrong counts..
may i know how to group indicator scores based on breakdown element..if my condition in indicator is on created date, the score should fall in the intersection of detected row, if the indicator condition is on resolution date, then it should fall under the intersection with patched..