- Post History
- Subscribe to RSS Feed
- Mark as New
- Mark as Read
- Bookmark
- Subscribe
- Printer Friendly Page
- Report Inappropriate Content
on 06-18-2022 07:00 PM
My organization's former ITSM platform had a report which showed a grid of several statistics by agent for a given date range. When we migrated to SN, there wasn't anything similar out of the box so I set out to build it. This article looks at what I did.
Below is a screenshot of the final product:

The above dashboard is comprised of two widgets:
- A dynamic content block widget for the date picker
- A simple list report. The list report is based on a remote table, the remote table gets its data from the PA scorecard REST API (some PA indicators are custom).
Note that I am using the incident table itself and not PA for some columns (Assigned incidents, Resolved incidents, Avg time to resolution, etc). These should really be converted to PA indicators as running stats on operational tables can impact performance. I have not included these columns in the rest of this article, only the columns I get from PA.
Also note that the purpose of these statistics is to give the service desk managers an idea of what agents are up to. They are perhaps a bit primitive, but they give the managers a general idea. Nobody is getting a promotion or a reprimand for the number of comments that they added to incidents.
Let’s take a closer look at each of the parts
Dashboard
The dashboard has two widgets:
- The date picker is a dynamic content block widget (Type: Content Block… Dynamic content).
<?xml version="1.0" encoding="utf-8" ?>
<j:jelly trim="false" xmlns:j="jelly:core" xmlns:g="glide" xmlns:j2="null" xmlns:g2="null">
    <script>
var my_dashboardMessageHandler = new DashboardMessageHandler("between_dates");

function publishFilter (fromDate,toDate) {

    var filter_message = {};
    filter_message.id = "between_dates";
    filter_message.table = "x_xxxx_agt_st_agent_report";


<!-- Add your own filter query logic here -->
    filter_message.filter = "fromON" + fromDate + "@javascript:gs.dateGenerate('" + fromDate + "','start')@javascript:gs.dateGenerate('" + fromDate + "','end')^toON" + toDate + "@javascript:gs.dateGenerate('" + toDate + "','start')@javascript:gs.dateGenerate('" + toDate + "','end')";

    SNC.canvas.interactiveFilters.setDefaultValue({
            id: filter_message.id,
            filters: [filter_message]
        }, false);
    my_dashboardMessageHandler.publishFilter(filter_message.table, filter_message.filter);

}


</script>


<!-- <input id="allTasks" type="button" value="All tasks" onclick="clearFilter();" />
<input id="onlyMine" type="button" value="Only mine" onclick="publishFilter();" /> -->
    <label for="from_date">From</label>
    <input type="date" id="from_date" name="from_date"/>
    <label for="to_date">To</label>
    <input type="date" id="to_date" name="to_date"/>
    <button onclick="publishFilter(document.getElementById('from_date').value,document.getElementById('to_date').value);">Submit</button><br/>
    <p>Note that some stats are only available the next day because they are collected at night: Open incidents start, Open incidents end, Incident views, Comments.  If the date range selected includes today, today's data will not be included for these stats.</p>

</j:jelly>- The second widget is a simple list report which displays the agent stats remote table.
Remote Table
The agent stats remote table definition is below, the main idea is:
- Get the parameter values (from the dynamic content block in the dashboard, otherwise these can also be specified in the list filter if accessing the remote table directly).
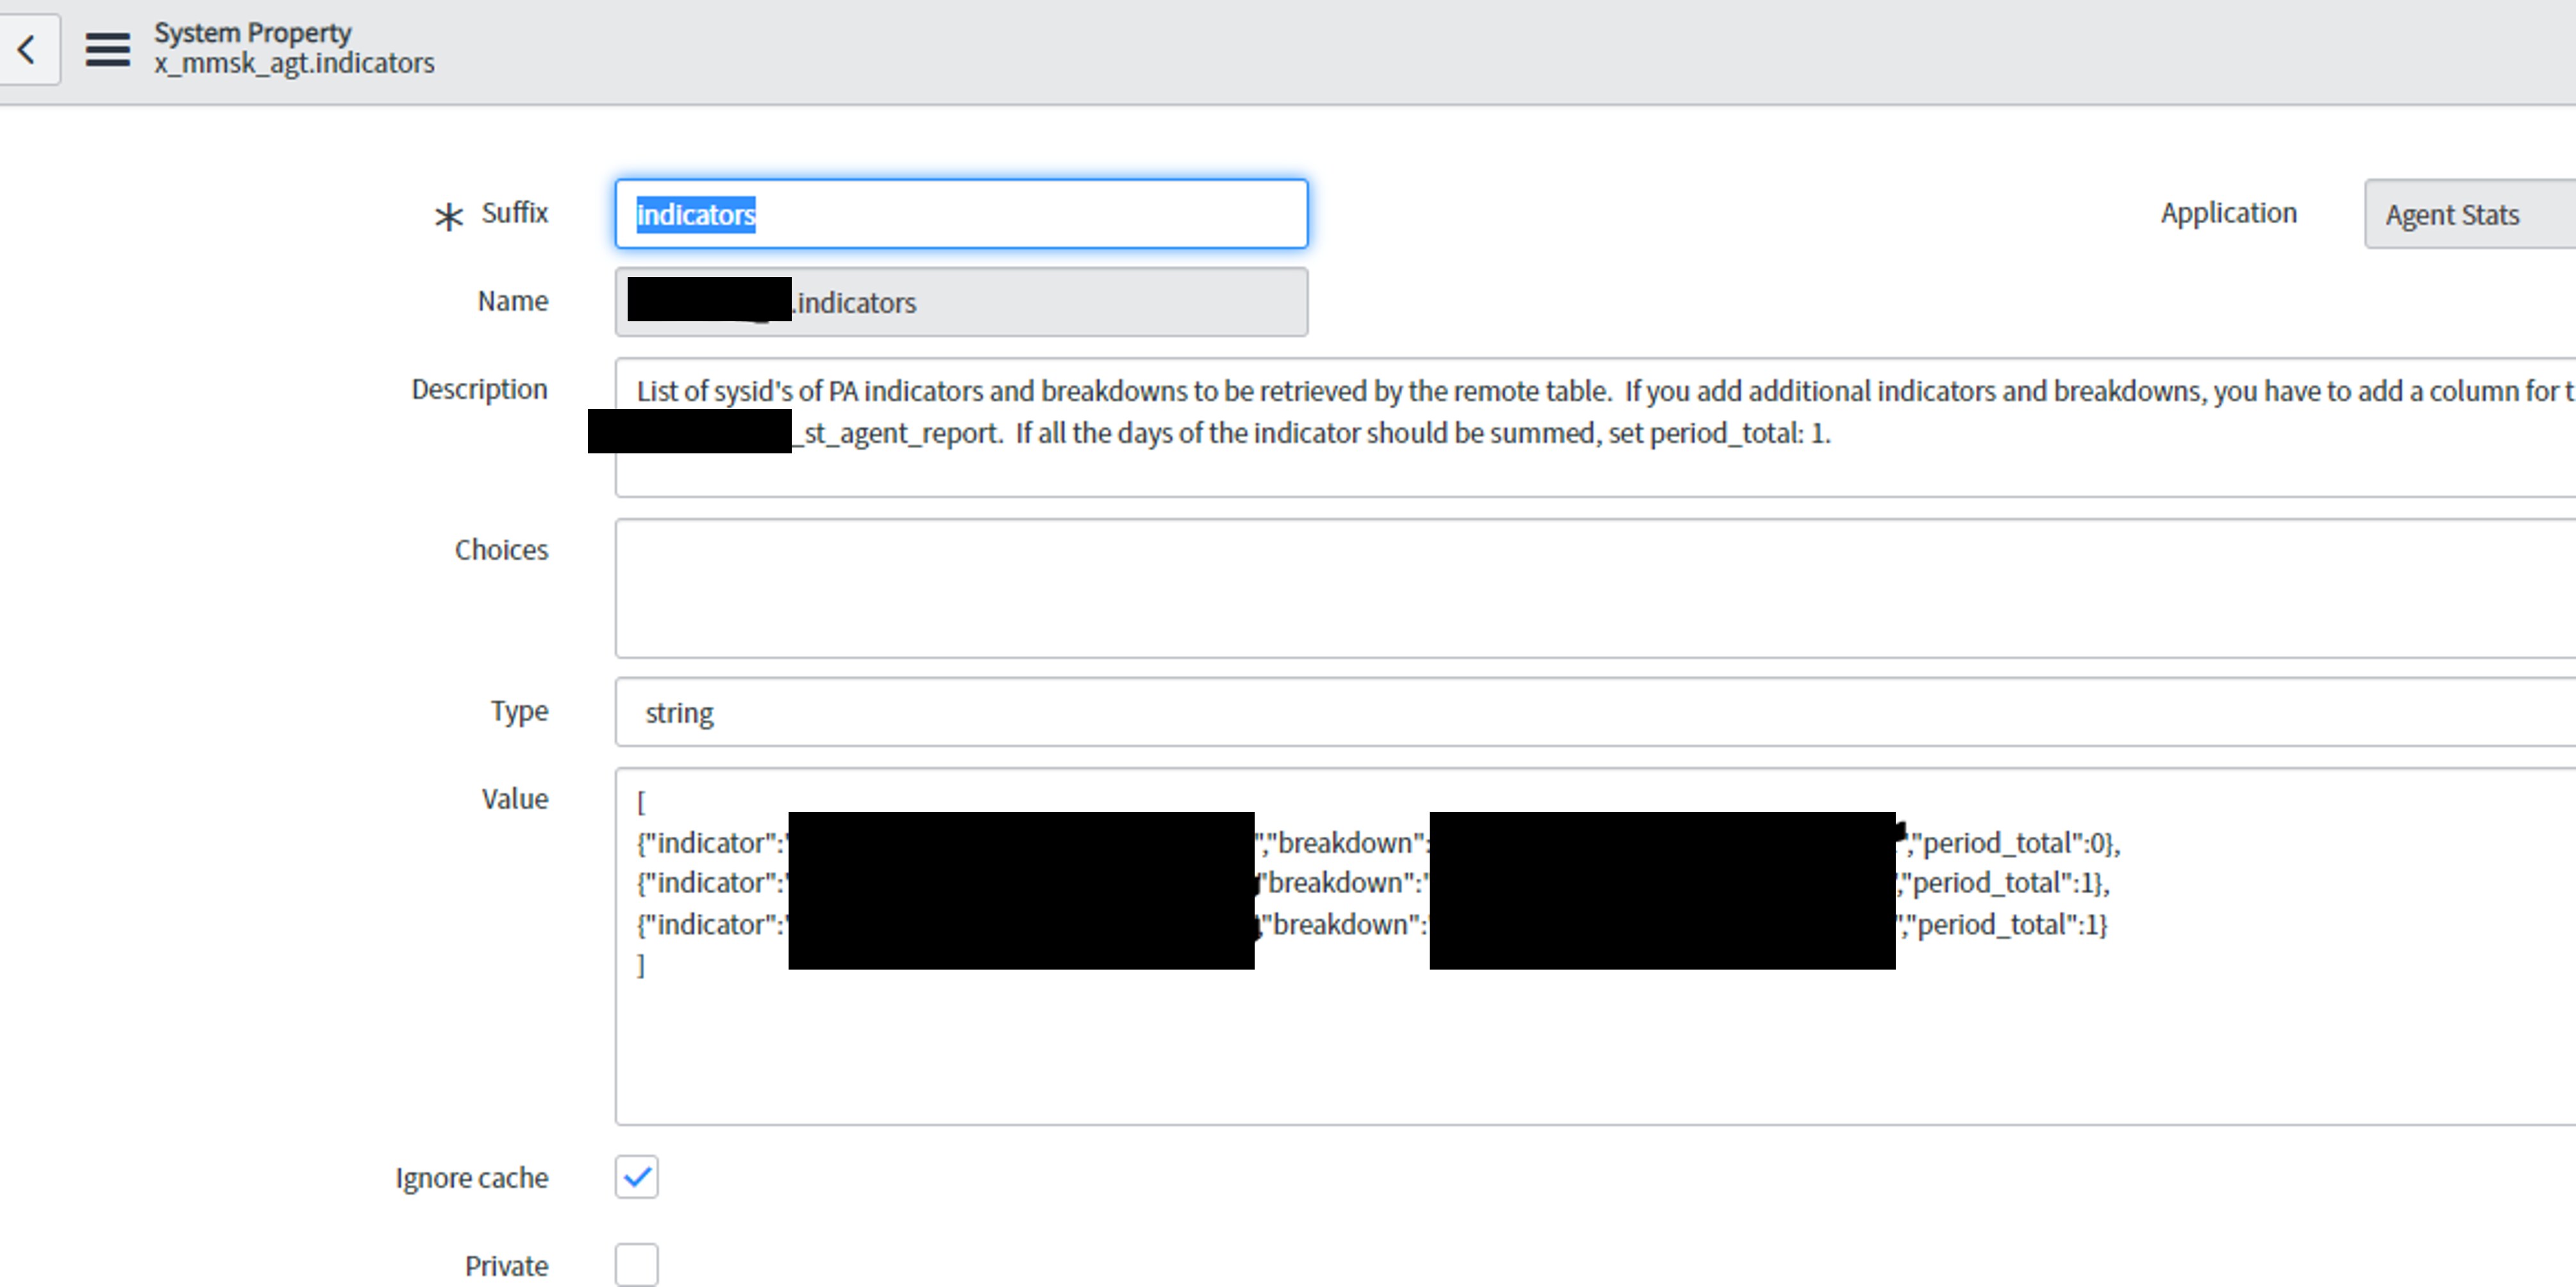
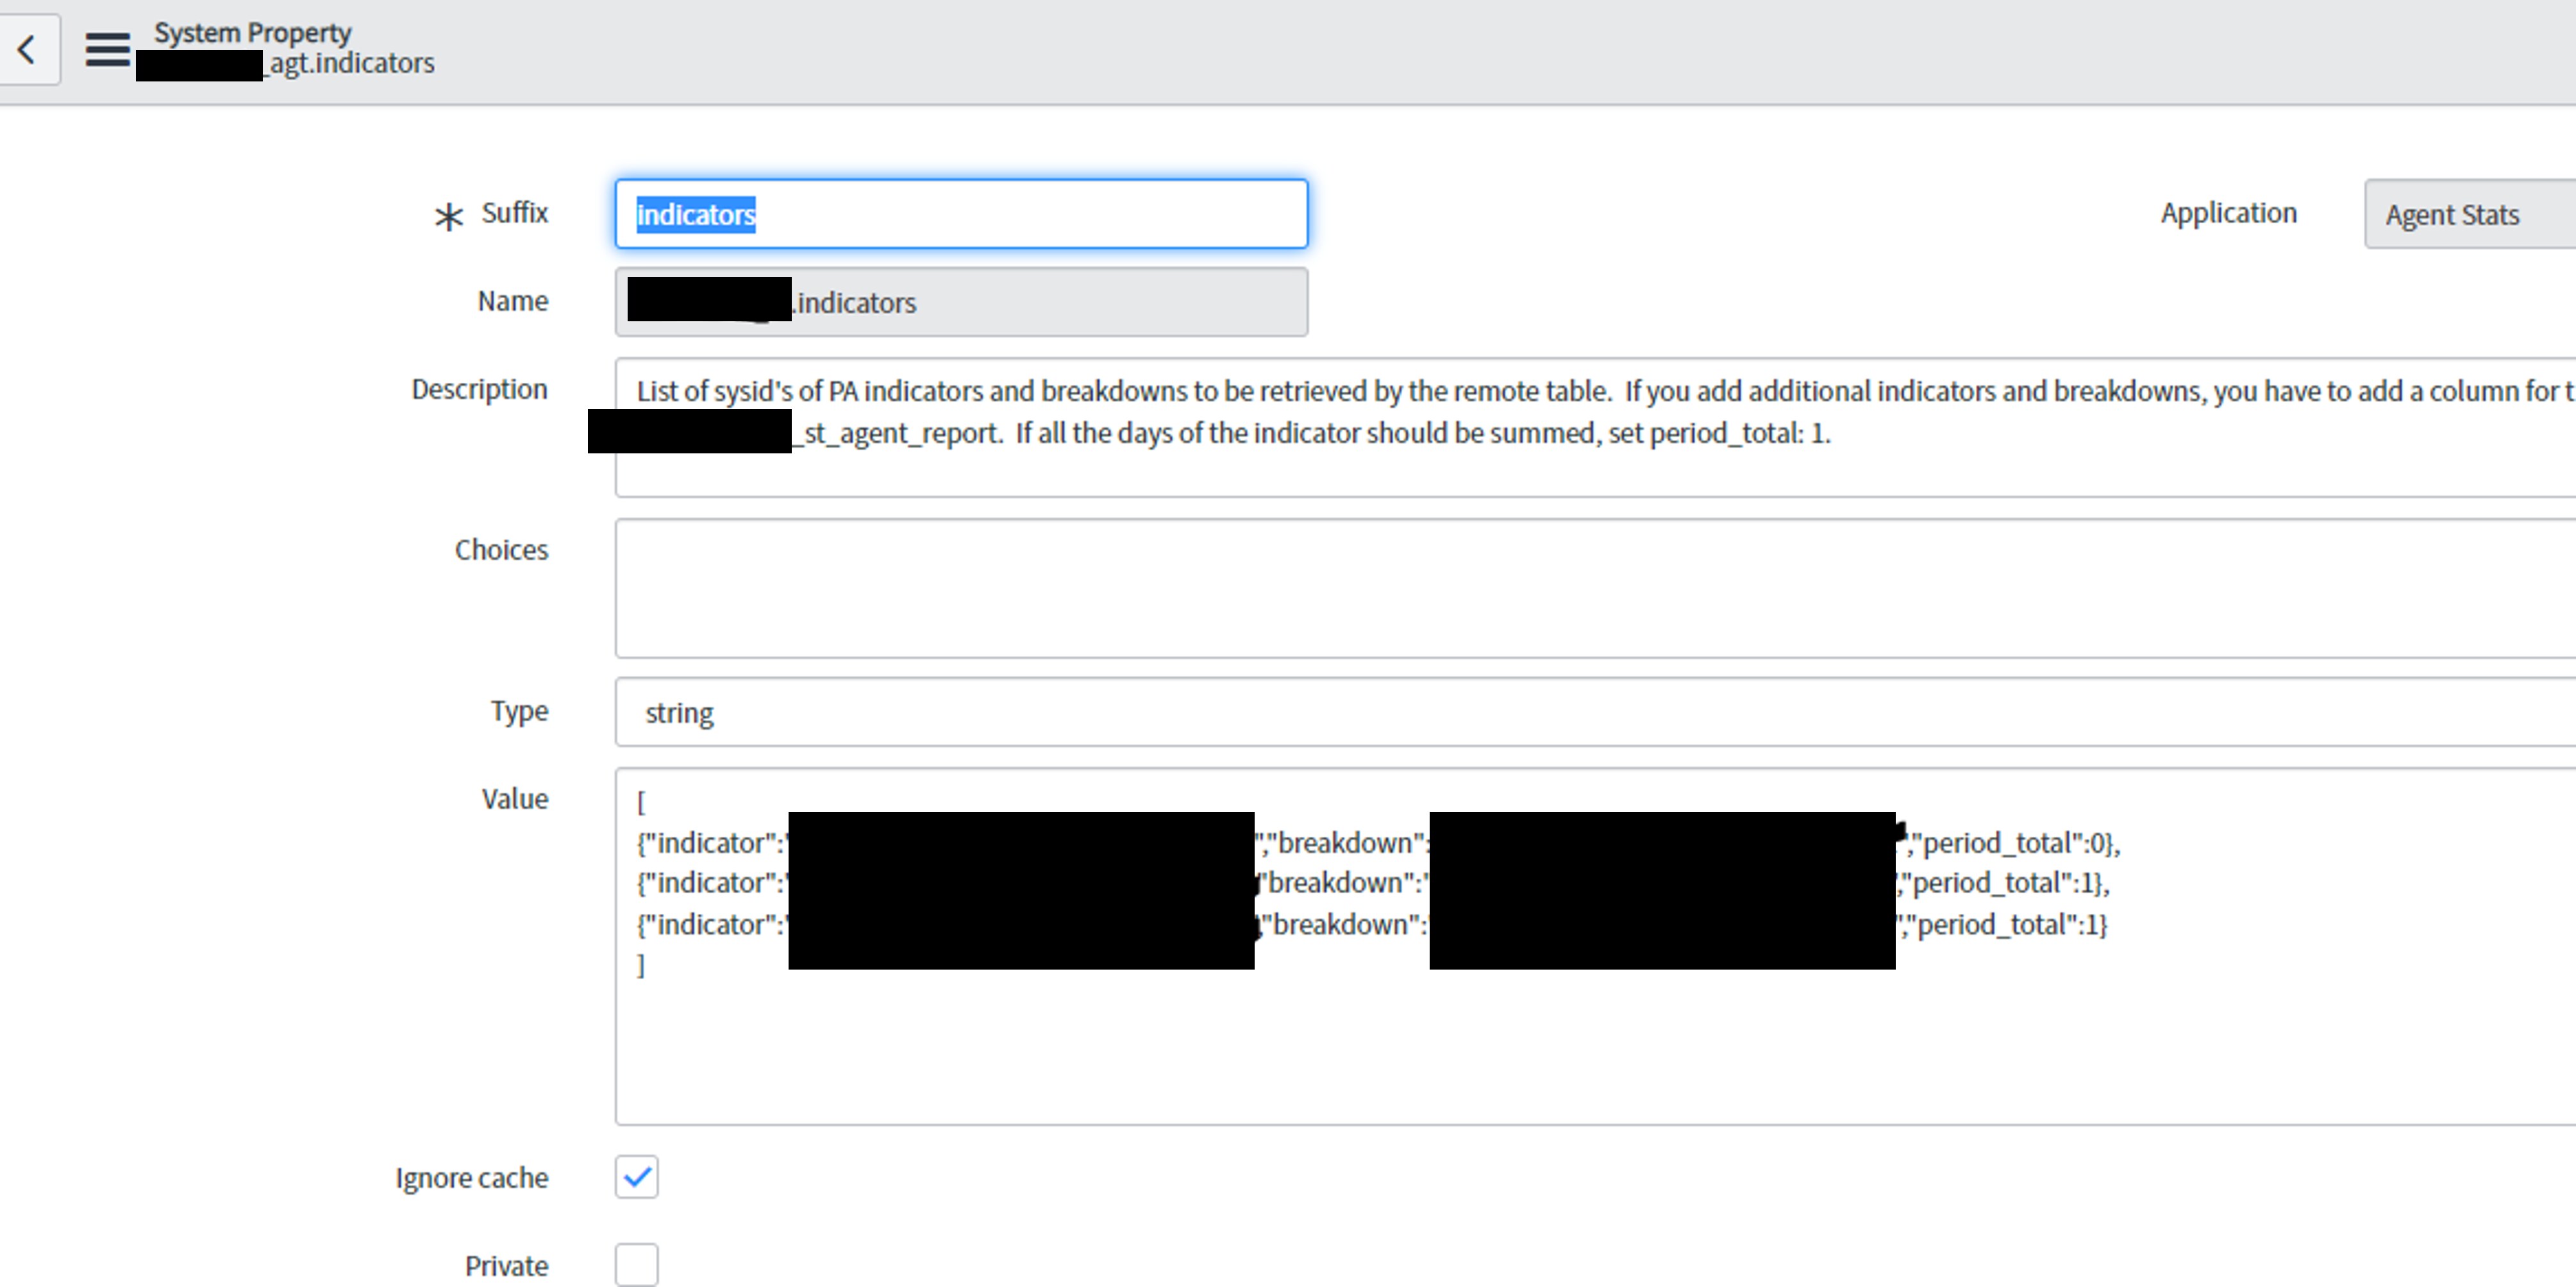
- Get the Performance Analytics Indicators for the report that are stored in a system parameter as JSON. I did this because the sysid’s for the PA indicators are different in dev and in prod. The sys property looks like this:
- Call a method in a script include (x_xxxx_agt.AgentReportUtils().getAgents()) which returns an array of objects with the sys_id’s and names of agents in SN like the below:
[ { "userSysId": "XXXXXXX", "userFullName": "Secret Agent" }, { "userSysId": "XXXXXXXXX", "userFullName": "Special Agent" } ] - Call another method in a script include (x_xxxx_agt.AgentReportUtils().getScorecardGrid(agents,dateFrom,dateTo,scorecards))which requests scorecards from the scorecard REST API on the same instance and then iterates through the array of agents created in step 3, adding statistics (scorecards) to each one. This returns an array like the below:
[
{
    "userSysId": "XXXXXXX",
    "userFullName": "Secret Agent",
    "NumberofopenincidentsEnd": 1,
    "NumberofopenincidentsStart": 1,
    "IncidentViewsEnd": 0,
    "IncidentViewsStart": 0,
    "IncidentViewsPeriodTotal": 0,

    "IncidentCommentsPeriodTotal":0
  },
  {
    "userSysId": "XXXXXXXXX",
    "userFullName": "Special Agent",
    "NumberofopenincidentsEnd": 1,
    "NumberofopenincidentsStart": 1,
    "IncidentViewsEnd": 0,
    "IncidentViewsStart": 0,
    "IncidentViewsPeriodTotal": 0,

    "IncidentCommentsPeriodTotal":0
  }
]

5. Iterate through the object and create rows in the remote table
Here is the remote table definition:
(function executeQuery(v_table, v_query) {

    //get the parameters from the dynamic content block
    var encodedQuery = v_query.getEncodedQuery();
    var fromStart = encodedQuery.indexOf('fromON') + 6;
    var toStart = encodedQuery.indexOf('^toON') + 5;
    var dateFrom = encodedQuery.substring(fromStart, fromStart + 10);
    var dateTo = encodedQuery.substring(toStart, toStart + 10);


    //get the indicators and breakdown sysid's from the system properties
    var scorecards = JSON.parse(gs.getProperty('x_xxxx_agt.indicators'));


    // only run if there is an actual dateFrom
    if (dateFrom) {
        //get the service desk agents

        var agents = new x_xxxx_agt.AgentReportUtils().getAgents();


        //populate the array with stats

        var agentsArr = new x_xxxx_agt.AgentReportUtils().getScorecardGrid(agents, dateFrom, dateTo, scorecards);


        // iterate through the array and create rows in the remote table
        for (i in agentsArr) {
            var rowObj = {};

            rowObj.sys_id = gs.generateGUID();
            rowObj.agent = agentsArr[i]['userSysId'];
            rowObj.from = dateFrom;
            rowObj.to = dateTo;

            rowObj.open_incidents_start = agentsArr[i]['NumberofopenincidentsStart'] || 0;
            rowObj.open_incidents_end = agentsArr[i]['NumberofopenincidentsEnd'] || 0;
            rowObj.incident_views = agentsArr[i]['IncidentViewsPeriodTotal'] || 0;
            rowObj.comments = agentsArr[i]['IncidentCommentsPeriodTotal'] || 0;
            rowObj.agent_name = agentsArr[i]['userFullName'];

            v_table.addRow(rowObj);
        }
    }

})(v_table, v_query)
Script Include
The AgentReportUtils() script include contains several methods for gathering the data points for the report. The first method, getAgents, gets all the users with the incident write role. The rest of the methods take the object and add data points to it.
/*
For the Agent Stats remote table

getAgents - returns object of all users with sn_incident_write
getScorecardGrid - returns the scorecards for the indicators and breakdown from the scorecard api.


Before using this script include, you need to create a basic authentication profile for the instance itself (for example, admin) and  set the x_xxxx_agt.authentication_profile system property with the sysid of this profile.
*/
var AgentReportUtils = Class.create();
AgentReportUtils.prototype = Object.extendsObject(global.AbstractAjaxProcessor, {
    type: 'AgentReportUtils',

    //method to get the users with the sn_incident_write role (these are the “agents”)
    getAgents: function() {
        userArr = [];
        var roleGr = new GlideRecord('sys_user_has_role');
        roleGr.addQuery("roleSTARTSWITHsn_incident_write");
        roleGr.query();
        while (roleGr.next()) {
            var userObj = {};
            userObj.userSysId = roleGr.user.sys_id.getDisplayValue();
            userObj.userFullName = roleGr.user.name.getDisplayValue();
            userArr.push(userObj);
        }
        return userArr;
    },
    //method to get PA indicators for users
    getScorecardGrid: function(userArr, dateFrom, dateTo, scorecards) {


        //*********************
        // Get each of the scorecards and add into the userArr

        // The scorecards parameter is an object containing the sys_id’s of the indicators and breakdowns

        for (var x in scorecards) {
            var endpoint = 'https://' + gs.getProperty('instance_name'); // REST endpoint is the instance itself
            endpoint += '.service-now.com/api/now/pa/scorecards?';
            endpoint += 'sysparm_uuid=' + scorecards[x]['indicator'];
            endpoint += '&sysparm_breakdown=' + scorecards[x]['breakdown'];
            endpoint += '&sysparm_from=' + dateFrom;
            endpoint += '&sysparm_to=' + dateTo;
            endpoint += '&sysparm_include_scores=' + true;
            endpoint += '&sysparm_per_page=' + '100';


            var request = new sn_ws.RESTMessageV2();
            request.setEndpoint(endpoint);
            request.setHttpMethod('GET');
            request.setAuthenticationProfile('basic', gs.getProperty('x_xxxx_agt.authentication_profile'));
            request.setRequestHeader("Accept", "application/json");

            var response = request.execute();
            var responseBody = JSON.parse(response.getBody());

            //the api returns the scores for each day (for most indicators).  For indicators like incident views, we actually want the total for the period.  The below section totals each of the scores up into the period_total.  Note that the flag in the object is also called period_total.  This flag indicates if we should calculate the period total or not.

            if (scorecards[x]['period_total'] == 1) {

                for (var z in responseBody.result) {

                    var scores = responseBody.result[z]['scores'];
                    var period_total = 0;
                    //set an initial value of 0, this will be written over
                    responseBody.result[z]['period_total'] = 0;
                    if (scores.length > 0) {
                        for (var i in scores) {
                            period_total += scores[i]['value'];
                        }
                    }
                    responseBody.result[z]['period_total'] = period_total;

                }
            }

            //get a unique name for the indicator by transforming the display name
            var indicatorName = responseBody.result[0].indicator.display_value.replaceAll(' ', '');

            //add the indicator to each of the user objects in the finalArr
            for (var y in userArr) {

                //write an initial value of null
                userArr[y][indicatorName + 'End'] = null;
                userArr[y][indicatorName + 'Start'] = null;
                for (var b in responseBody.result) {

                    //if the scorecard user matches the finalArray user then write the scorecard to the object
                    if (userArr[y]['userSysId'] == responseBody.result[b]['element']['value']) {
                        userArr[y][indicatorName + 'End'] = responseBody.result[b]['value'];

                        //the last object in the scores array is the indicator at period start
                        if (responseBody.result[b]['scores'].length > 0) {
                            var firstScore = responseBody.result[b]['scores'].length - 1;
                            userArr[y][indicatorName + 'Start'] = responseBody.result[b]['scores'][firstScore]['value'];
                        }
                        //add the PeriodTotal to the object.  This doesn't make sense for some indicators (like open incidents) but for others it does (incident views).  We take what we need in the remote table definition.
                        userArr[y][indicatorName + 'PeriodTotal'] = responseBody.result[b]['period_total'];

                    }

                }
            }


        }
        return userArr; //returns the array of user objects, now populated with stats from PA.
    }

});
- 1,972 Views