- Post History
- Subscribe to RSS Feed
- Mark as New
- Mark as Read
- Bookmark
- Subscribe
- Printer Friendly Page
- Report Inappropriate Content
12-08-2020 10:21 PM - edited 10-15-2022 01:44 AM

A user asked in the community how to combine opened and closed task records in one chart over the last 12 months, and I want to give the answer with the following manual. The basic approach is to create an individual dataset and then include this dataset in an existing report.
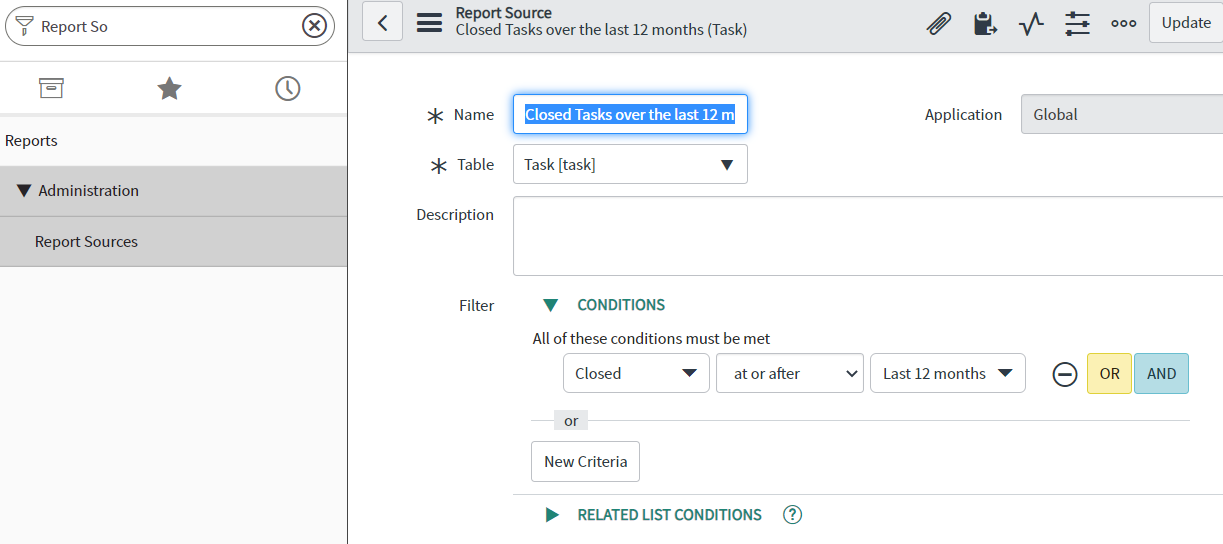
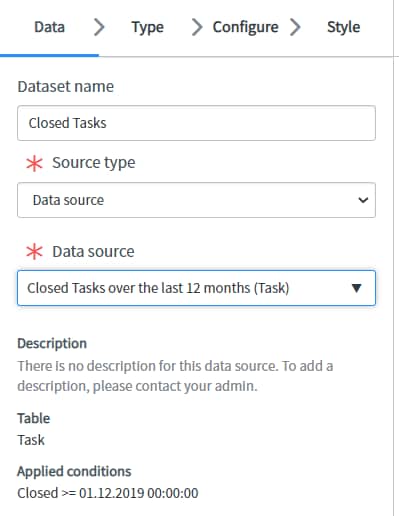
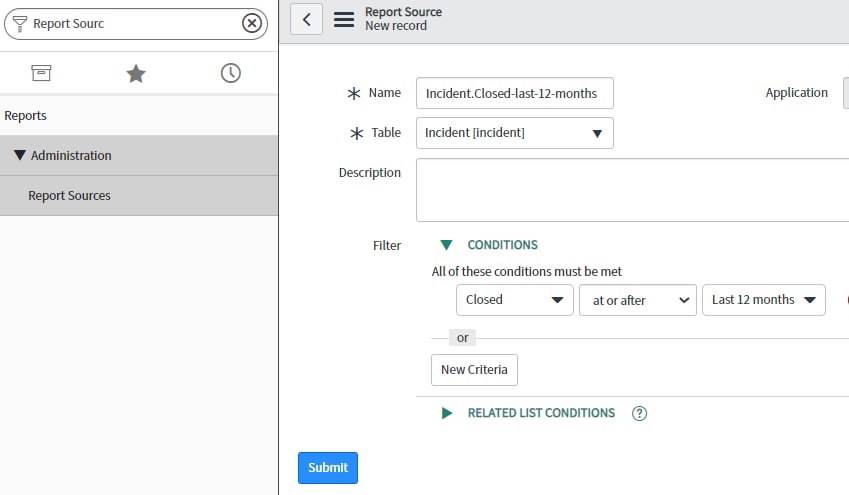
Create a new report source
Go to Reports > Report Sources and click on "New". Then define the criteria for collecting all closed tasks over the last 12 months:

Create new report
Go to Reports > Create new and fill out the configurations as described:
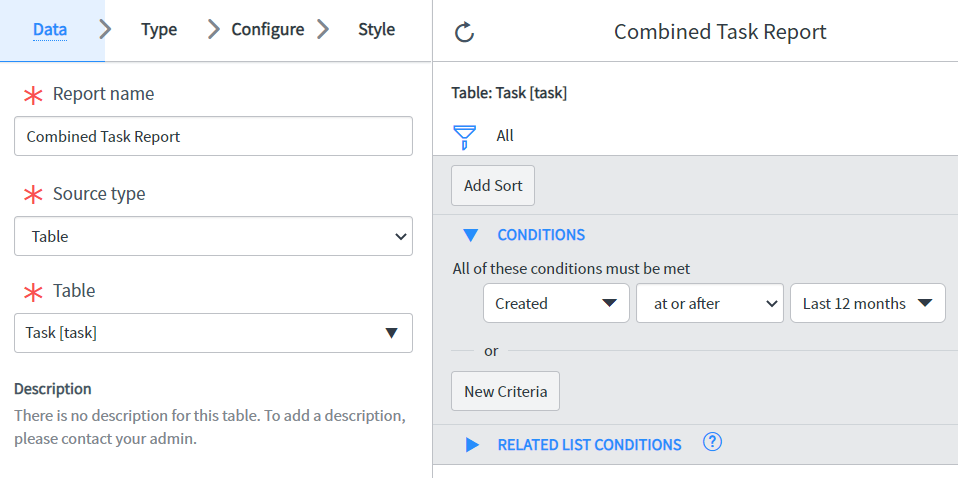
Data
- Source Type: Table
- Table: task
- Conditions: Created at or after last 12 Months (click on filter icon in the right pane)

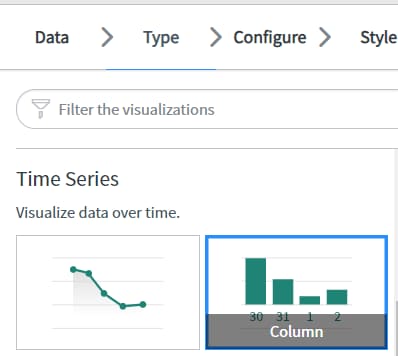
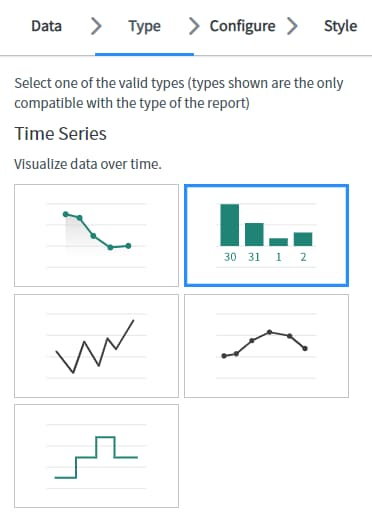
Type
Choose "Column" at report category "Time Series":

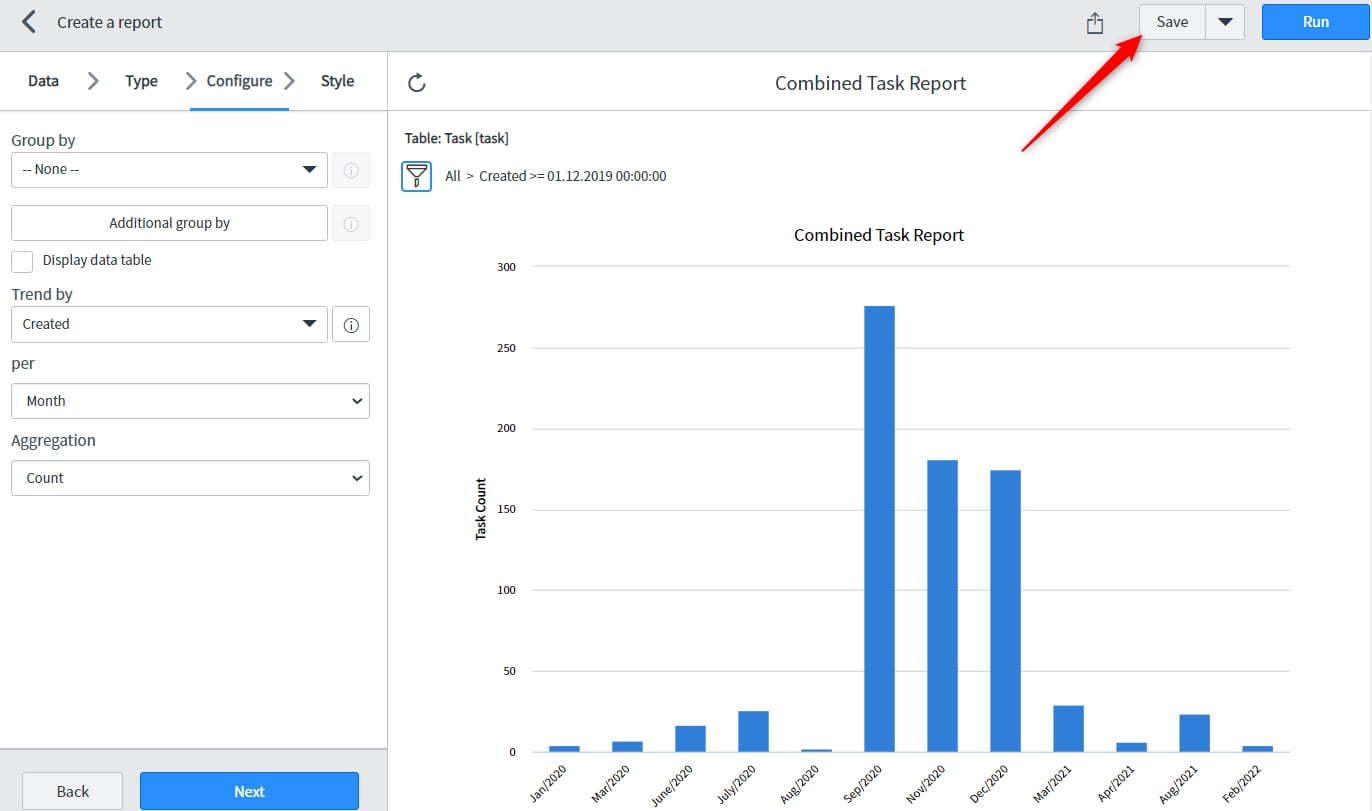
Configure
- Trend by: Created
- per: Month
- Aggregation: Count
Finish
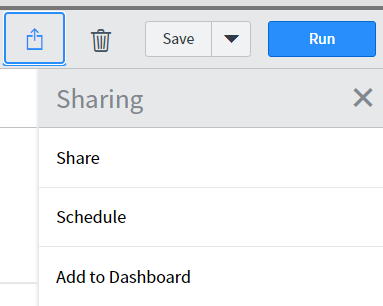
Click "Run" and after that "Save":

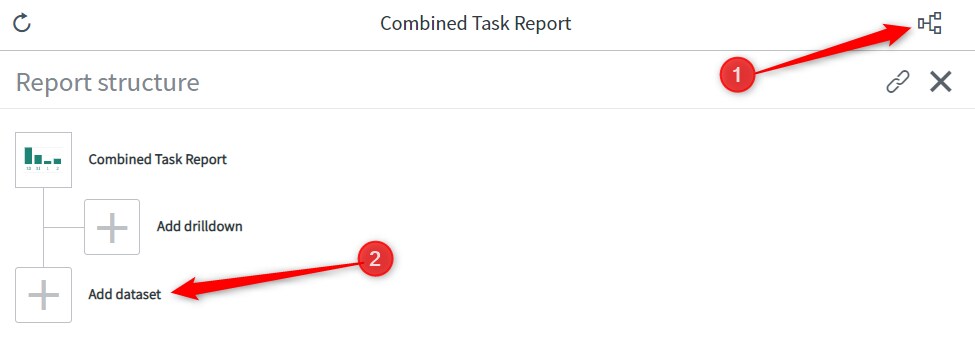
Add Report source
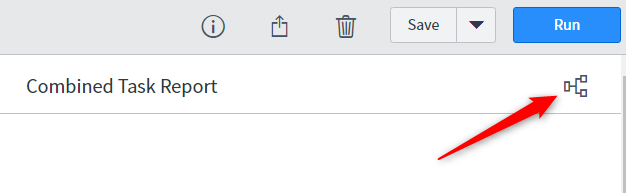
(1) Click on the icon right beside the Headline and then
(2) Add dataset

Data
Select the previously saved report source "Closed Tasks over the 12 months"

Type
Choose again "Column" as chart type:

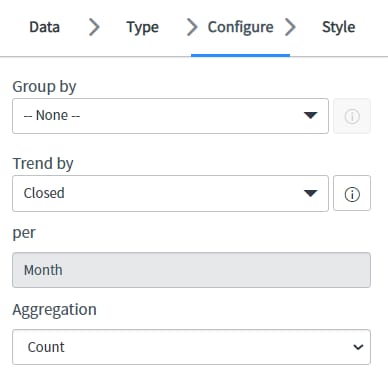
Configure
- Trend: Closed
- per: Month (not changeable)
- Aggregation: Count

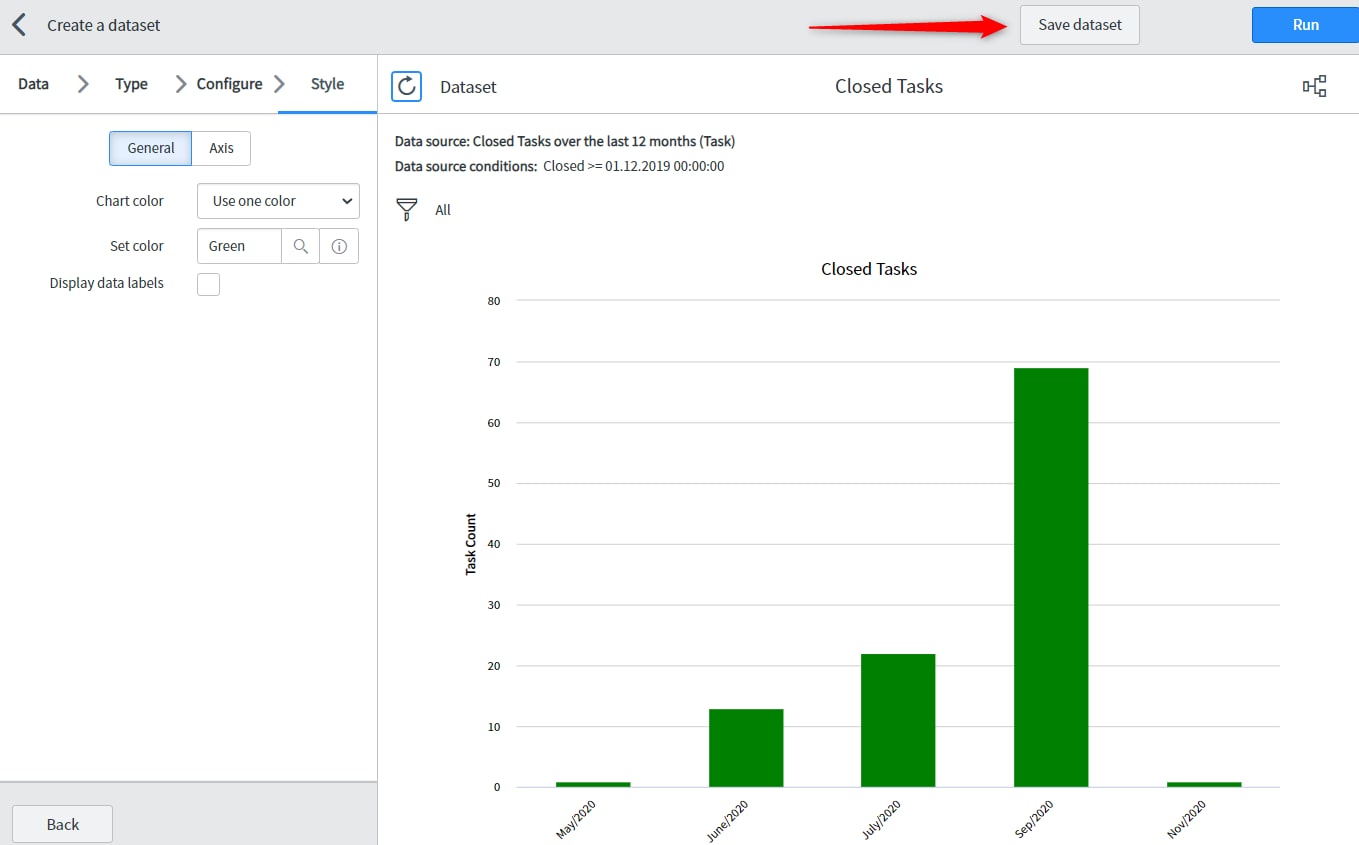
Style
Select a suitable color. Then click on "Save dataset":

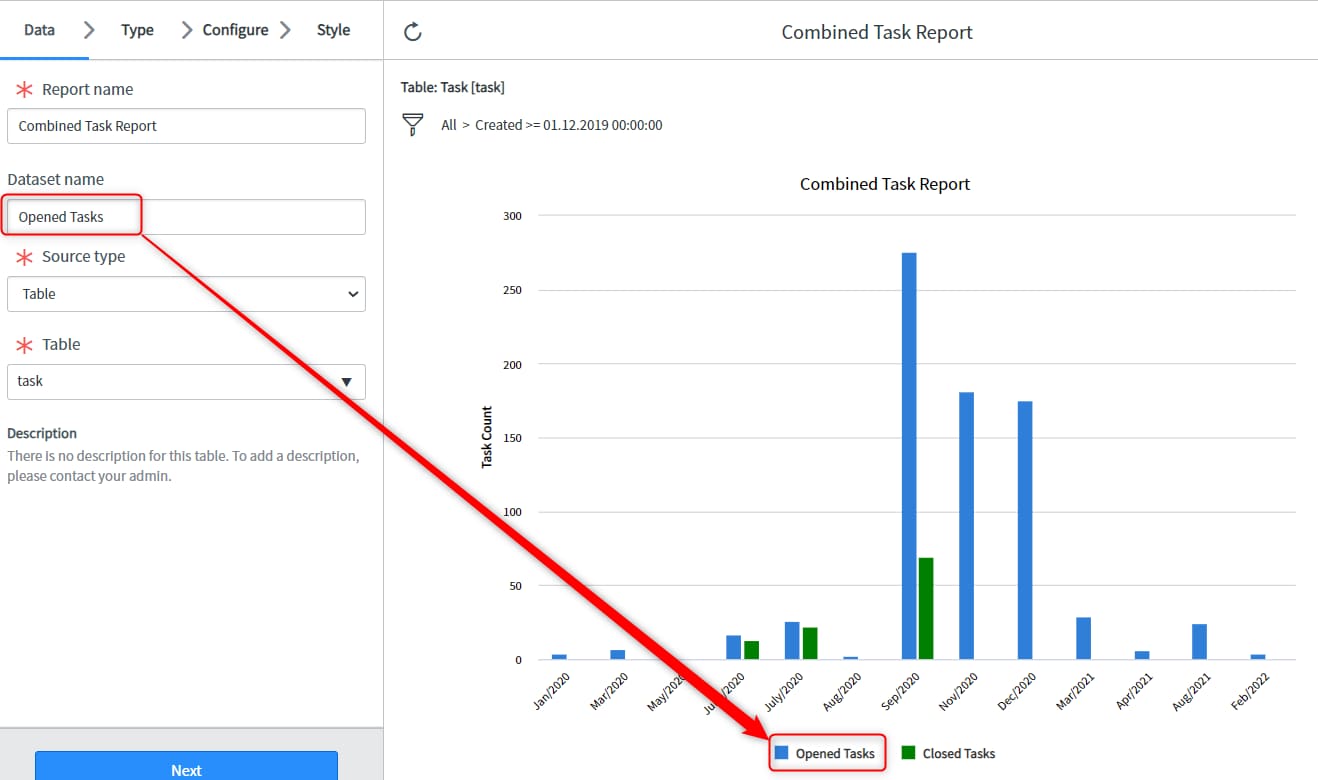
Finalize and add to dashboard
On the left side, add a "Dataset name" for the "Opened Tasks" bars. Then save the report:

Click on share icon to add this report to an existing dashboard:

- 35,686 Views
- Mark as Read
- Mark as New
- Bookmark
- Permalink
- Report Inappropriate Content
Would it be possible to use interactive filtering with reports of this type?
- Mark as Read
- Mark as New
- Bookmark
- Permalink
- Report Inappropriate Content
can we add more dataset into the one report
- Mark as Read
- Mark as New
- Bookmark
- Permalink
- Report Inappropriate Content
This is absolutely brilliant - thank you so much.
- Mark as Read
- Mark as New
- Bookmark
- Permalink
- Report Inappropriate Content
From what I can tell I did exactly what you did, but I still get the "The report drilldown is incorrectly configured to the table. Delete the drill and create a new one, or change the main report's table" mention.. I don't know why it is expecting a drilldown when I have added a dataset..

- Mark as Read
- Mark as New
- Bookmark
- Permalink
- Report Inappropriate Content
The first step you did was to create a Dataset under reports > Administration. So it appears that I need to have admin permissions/role to perform this task. What if I an end-user or IT user but dont have admin permissions to do this Dataset creation? Is there any alternative that will allow me to create this Dataset by myself or do I raise a ticket to the ServiceNow Admin to get this Dataset created?
- Mark as Read
- Mark as New
- Bookmark
- Permalink
- Report Inappropriate Content
Datasets - for roles the following applies: Role required: itil, report_user. The property glide.ui.doctype must be enabled. They have the same style of report sources as reports. e.g. Table, or data source.
To be able to add one to a report - the following must be met:
Bear the following restrictions in mind when creating a report with multiple data sets:
- Up to a maximum of 5 additional datasets can be added to any particular report. Keep in mind that each additional dataset will require additional processing and querying of the database, so if a particular report is experiencing performance issues, it could be due to the fact the report has multiple data sets associated.
- All datasets associated with a parent report must be of the same type (such as bar, donut, or pie) as the parent report.
- For multiple datasets associated with a time series chart, all additional data sets must have the same setting in the Per field as the parent report.
- For multiple datasets on a Bar or Horizontal Bar chart, all associated datasets must have the same Group By value.
- The Show Legends option is always, by default, displayed on a report with multiple datasets, even if the parent report has this option unselected.
- Mark as Read
- Mark as New
- Bookmark
- Permalink
- Report Inappropriate Content
Thanks for detailing that, however that will only get a person so far as I found out, as SN has limited the product they offer by restricting the data set amount.
"a maximum of 5 additional datasets"
It seems to be actually limited to only 4, with the root of the report (if a dataset) being the 5th. So it seems SN doesn't even know their own product.
Do you know of another way to actually retrieve data and count the results from multiple CMDB tables, and compare them in a report?