- Post History
- Subscribe to RSS Feed
- Mark as New
- Mark as Read
- Bookmark
- Subscribe
- Printer Friendly Page
- Report Inappropriate Content
on 05-28-2019 06:39 AM
We have considered a basic example to explore performance analytics(PA) for incident management.
Here, we have created a report on the PA dashboard to show the count of open and closed incidents per month.
We have used the ootb PA incident management. The following are the steps and minor changes that we have made
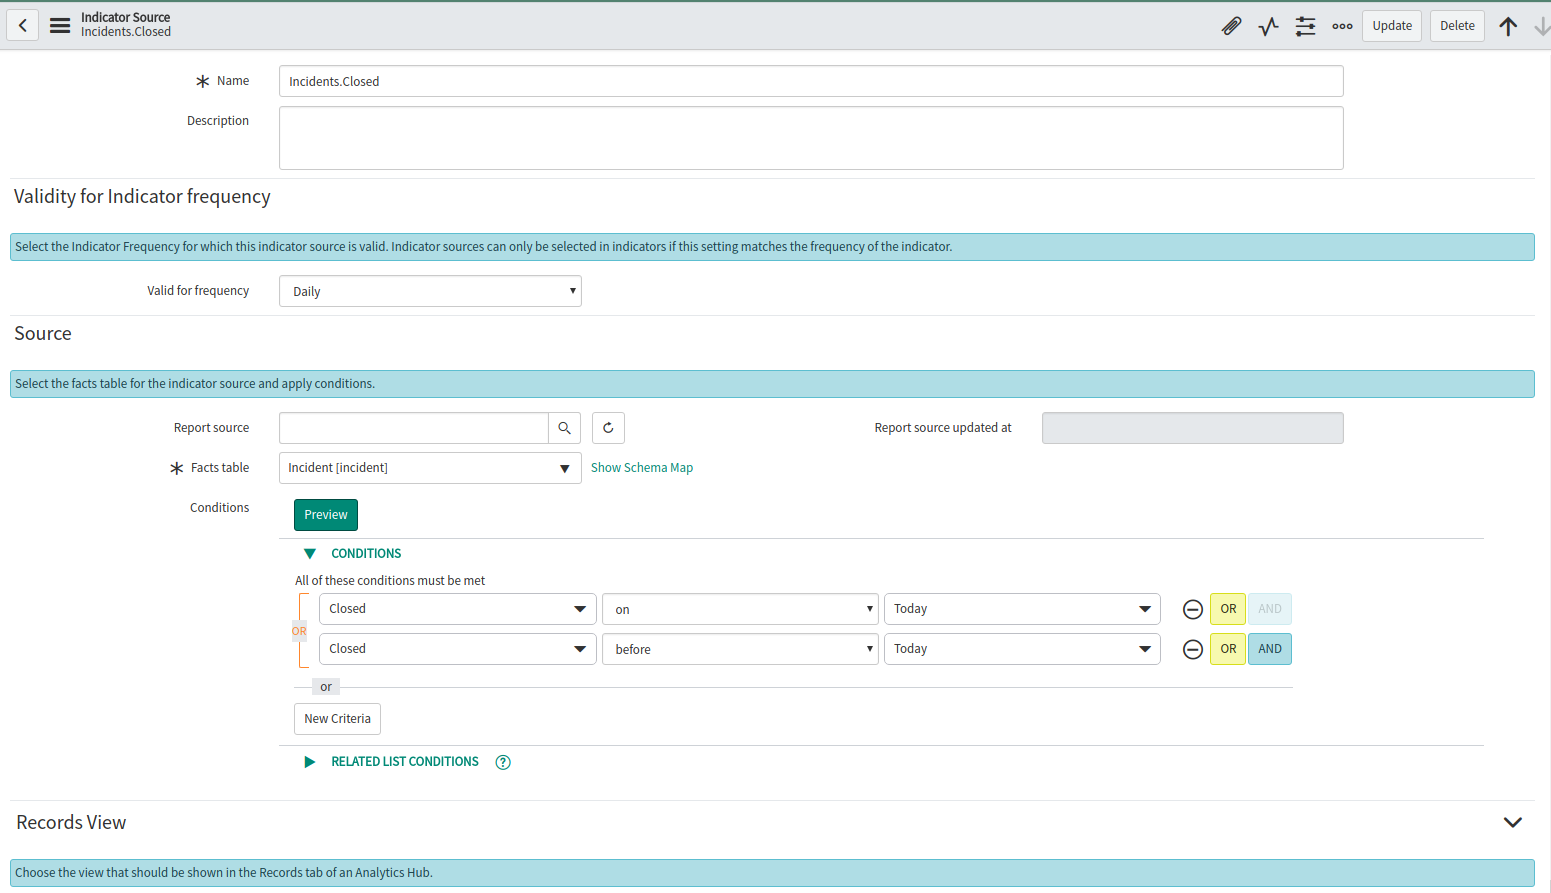
1. Indicator sources
Go to Performance Analytics --> Sources --> Indicator Sources
We mention the source of the data and the conditions here.
- there are a few indicator sources that are already created. Here, we have selected Incidents.Open . It looks like below

- Similarly, we have created one for Incidents.Closed

2. Indicators
We didn't have to create any indicators. we used the existing indicators.
Go to Performance Analytics --> Indicators --> Automated Indicators
- Name - Number of open incidents
- Name - Number of closed incidents
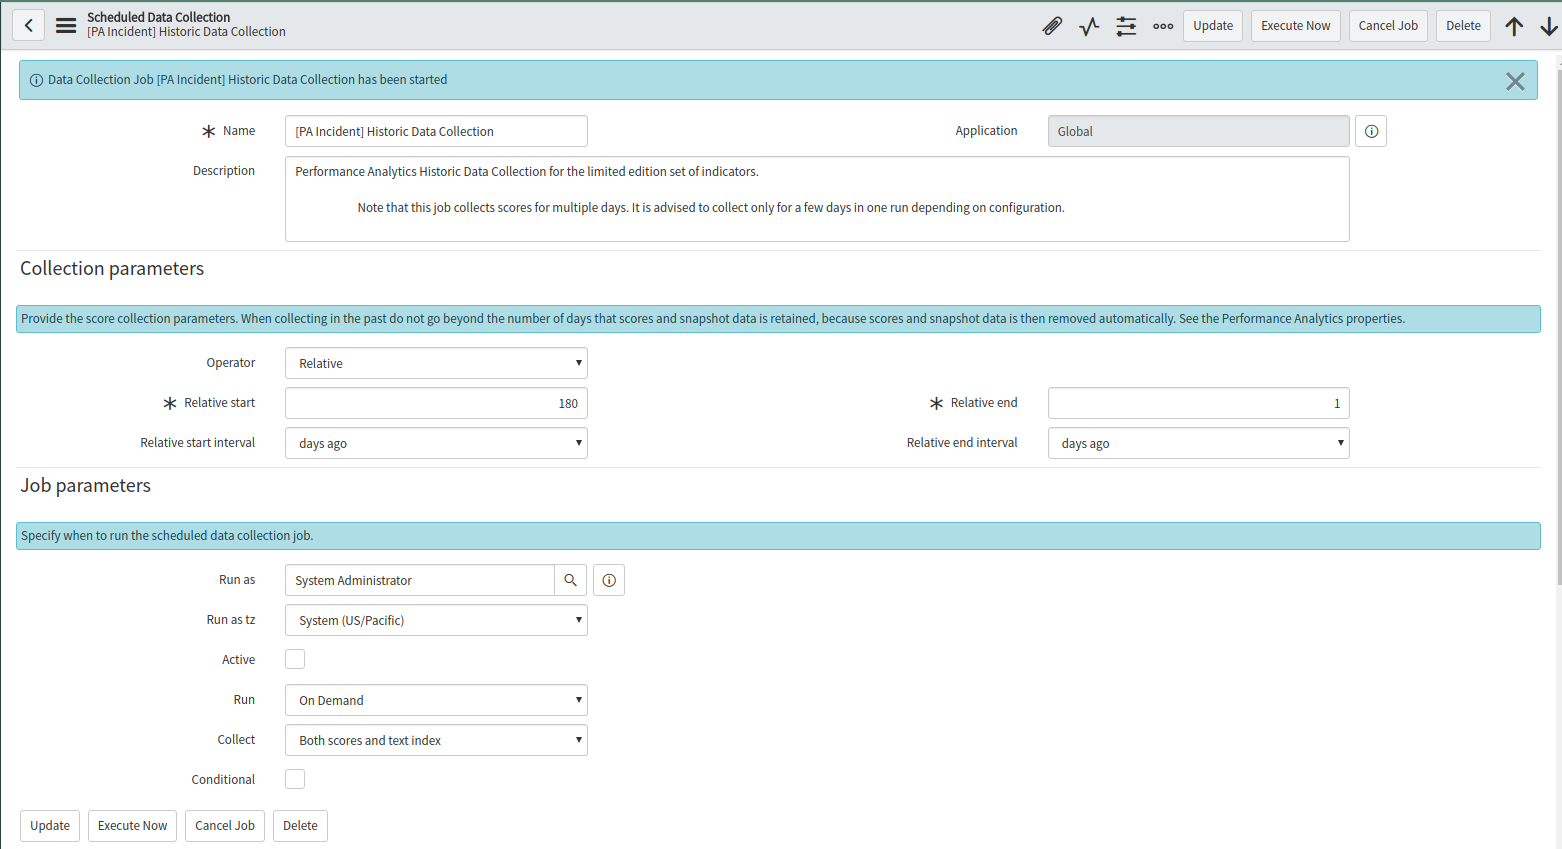
3.Data Collection
Go to Performance Analytics --> Data Collector --> Jobs
- select [PA Incident] Historic Data Collection. This is run on Demand(It can be set accordingly)
- select Execute Now.
Here, it collects all the data depending on the breakdowns mentioned in the indicators.

Collection Parameters can be changed according to the interval.
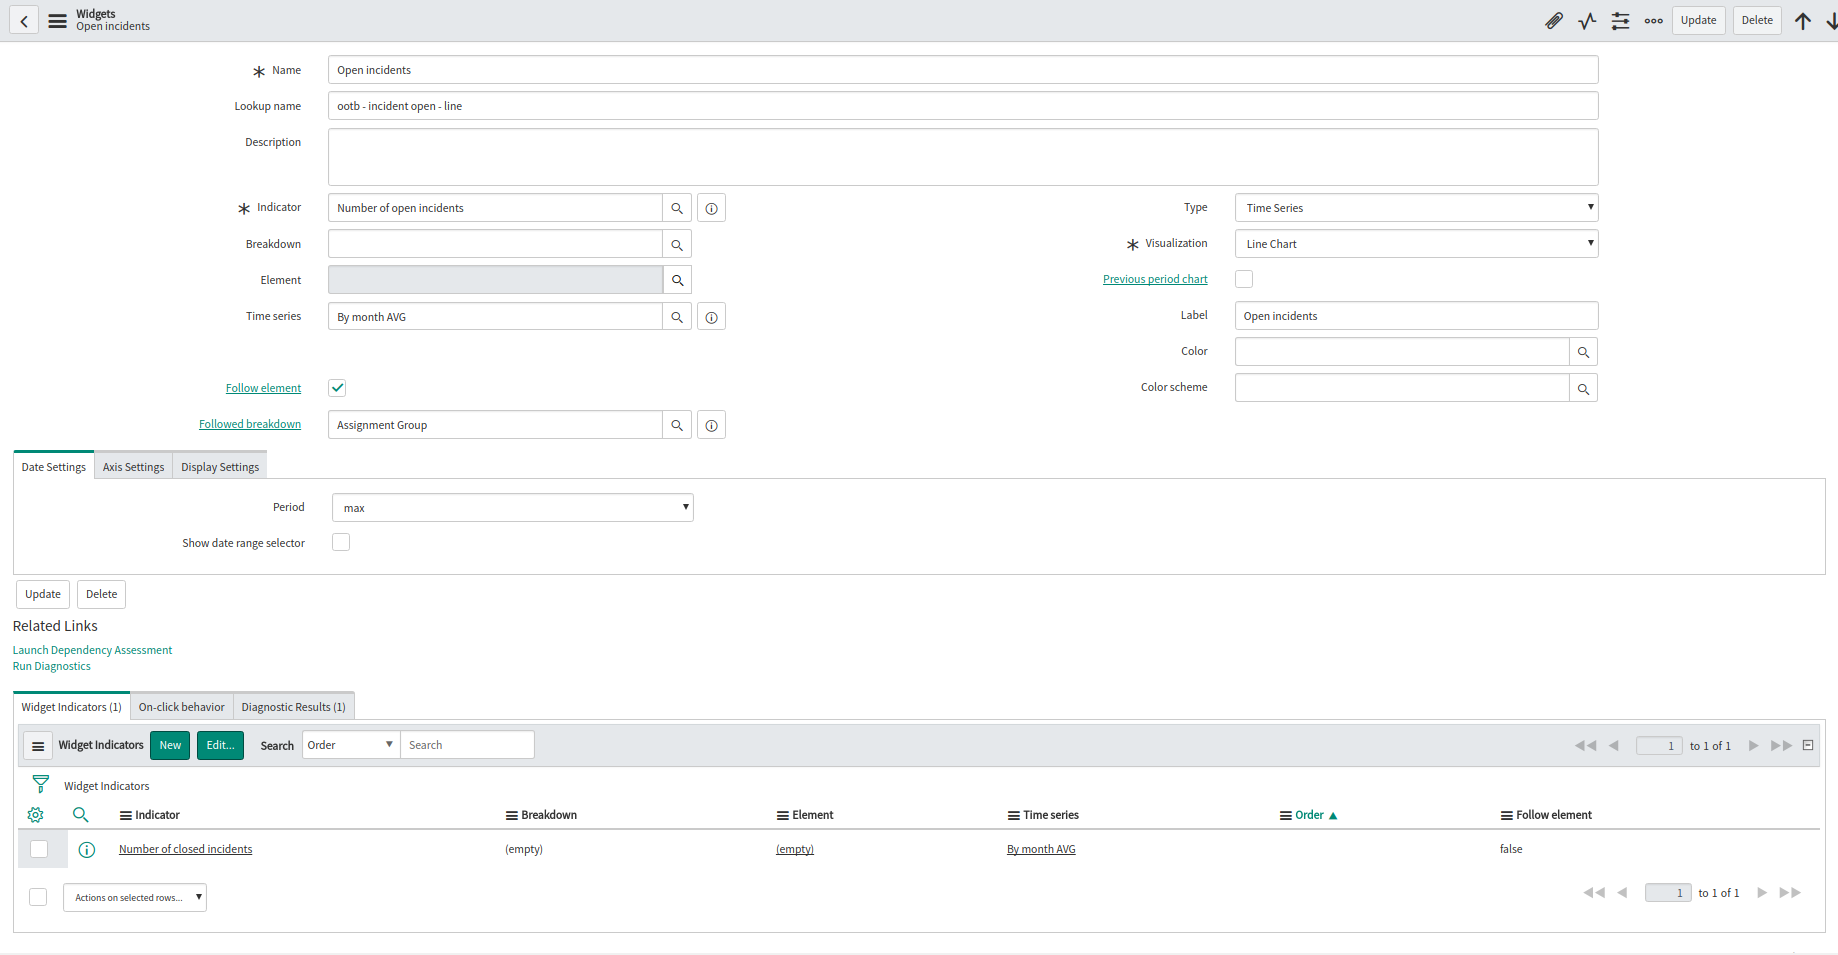
3. Widget
Go to Performance Analytics --> Widget
To Display the data in the form of a report we use the PA Widgets.
Create a new widget with the indicators mentioned above. Please find below the screenshot

4. Add to Dashboard
Go to Performance Analytics --> Dashboard
Here, search for the widget and add it to the dashboard

This is a basic demo to start with PA. Hope it helps!
- 11,766 Views
- Mark as Read
- Mark as New
- Bookmark
- Permalink
- Report Inappropriate Content
hi @rad2,
this article is really helpful for me to find the incident close per month looking forward.
can you please suggest to me how I can do this configuration for
1 ) Incidents closed per day in the last three months.
2 ) Incidents closed per week in the last three months.