- Post History
- Subscribe to RSS Feed
- Mark as New
- Mark as Read
- Bookmark
- Subscribe
- Printer Friendly Page
- Report Inappropriate Content
on 12-01-2021 03:08 AM
Goal
To create a Power BI dashboard to report on the aggregated costs of business capabilities.

ServiceNow
In ServiceNow I'm using the Cost Management tool to create expense lines and allocations for my business capability tree. Task and contract rate cards are used to create Labor and Software Opex expense lines against the CMDB service. Task expense lines are best guesses based on our staffing cost, divided through by the ticket volumes e.g. £70 per incident for our first-line Service Desk and £140 if it is escalated to another team. Contract rate cards are set as the software license/subscription cost per month. Cost Relationship Paths are used to roll-up expenses to the Business Application and an Expense Allocation to allocate the expenses to the Business Capability. Our CMDB is not CSDM-aligned so you may require different relationship paths to get expense lines rolling up to the capability level.

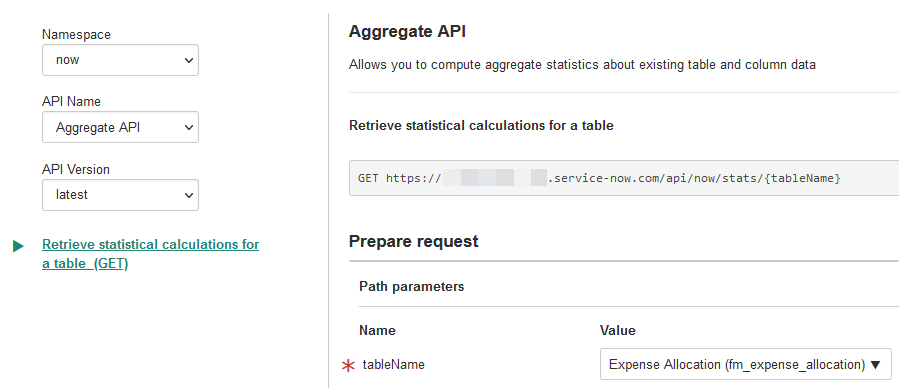
To get the data out of ServiceNow and into Power BI I'm using the Aggregate REST API. I started in the REST API explorer using Aggregate API and the fm_expense_allocation table. For now I'm not applying any query filtering.

I want the sum of amount and group by month, target and expense line's resource type.

And display value to true.

Querying gives a JSON output of e.g.
{
  "result": [
    {
      "stats": {
        "sum": {
          "amount": "0.0000"
        }
      },
      "groupby_fields": [
        {
          "field": "expense_line.resource_type",
          "value": "Labor Capex"
        },
        {
          "field": "month",
          "value": "2021-08"
        },
        {
          "field": "target",
          "value": "Business Capability: Staff Recruitment"
        }
      ]
    },
...
The query URL is provided in the Request section.
https://{instance name}.service-now.com/api/now/stats/fm_expense_allocation?sysparm_sum_fields=amount&sysparm_group_by=month%2Ctarget%2Cexpense_line.resource_type&sysparm_display_value=true
Lastly I needed to give a user a password and roles to access the data, which were itil and financial_mgmt_admin. Unfortunately you need the admin role to access the resource type table. It would be better to grant a lower privileged role and add an ACL to the resource type.
Power BI
I created a new dataset/report in Power BI Desktop. I used a Web resource to request the URL from ServiceNow and gave it the credentials for the user configured in ServiceNow.


Power BI does its best to unpack the JSON data but ends up giving us multiple rows for each Aggregate group by.

Using the Advanced Editor I replaced the default Power Query with row transforms and a pivot that put each group-by in its own column (replace {instance}).
let
    Source = Json.Document(Web.Contents("https://{instance}.service-now.com/api/now/stats/fm_expense_allocation?sysparm_sum_fields=amount&sysparm_group_by=target%2Cmonth%2Cexpense_line.resource_type&sysparm_display_value=true")),
    #"Converted to Table" = Table.FromRecords({Source}),
    #"Expanded result" = Table.ExpandListColumn(#"Converted to Table", "result"),
    #"Expanded result1" = Table.ExpandRecordColumn(#"Expanded result", "result", {"stats", "groupby_fields"}, {"result.stats", "result.groupby_fields"}),
    #"Expanded result.stats" = Table.ExpandRecordColumn(#"Expanded result1", "result.stats", {"sum"}, {"result.stats.sum"}),
    #"Expanded result.stats.sum" = Table.ExpandRecordColumn(#"Expanded result.stats", "result.stats.sum", {"amount"}, {"result.stats.sum.amount"}),
    #"Expanded result.groupby_fields" = Table.TransformColumns(#"Expanded result.stats.sum", {{"result.groupby_fields", Table.FromRecords}}),
    #"Pivot result.groupby_fields" = Table.TransformColumns(#"Expanded result.groupby_fields",
{{"result.groupby_fields", each Table.Pivot(_, {"month", "target", "expense_line.resource_type"}, "field", "value")}}
),
    #"Expanded result.groupby_fields1" = Table.ExpandTableColumn(#"Pivot result.groupby_fields", "result.groupby_fields", {"month", "target", "expense_line.resource_type"}, {"month", "target", "expense_line.resource_type"}),
    #"Split Column by Delimiter" = Table.SplitColumn(#"Expanded result.groupby_fields1", "target", Splitter.SplitTextByEachDelimiter({": "}, QuoteStyle.Csv, false), {"target.1", "target.2"}),
    #"Renamed Columns" = Table.RenameColumns(#"Split Column by Delimiter",{{"target.2", "Capability"}, {"expense_line.resource_type", "Resource Type"}, {"result.stats.sum.amount", "Amount"}, {"month", "Month"}, {"target.1", "Class"}}),
    #"Changed Type" = Table.TransformColumnTypes(#"Renamed Columns",{{"Amount", type number}})
in
    #"Changed Type"
Along with some column labelling and data types this gave me one row per group-by. Power BI itself will be used to sum up all the values for a month but by having the extra capability and resource type columns we can make a richer dashboard.

I also imported Business Capabilities as a separate data set. Power BI magically relates the expenses capability to the capability table.
let
    Source = Json.Document(Web.Contents("https://{instance}.service-now.com/api/now/table/cmdb_ci_business_capability?sysparm_display_value=true&sysparm_exclude_reference_link=true&sysparm_fields=parent%2Cname%2Chierarchy_level")),
    #"Converted to Table" = Table.FromRecords({Source}),
    #"Expanded result" = Table.ExpandListColumn(#"Converted to Table", "result"),
    #"Expanded result1" = Table.ExpandRecordColumn(#"Expanded result", "result", {"parent", "name", "hierarchy_level"}, {"result.parent", "result.name", "result.hierarchy_level"}),
    #"Changed Type" = Table.TransformColumnTypes(#"Expanded result1",{{"result.parent", type text}, {"result.name", type text}}),
    #"Renamed Columns" = Table.RenameColumns(#"Changed Type",{{"result.parent", "parent"}, {"result.name", "name"}, {"result.hierarchy_level", "level"}}),
    #"Filtered Rows" = Table.SelectRows(#"Renamed Columns", each ([level] = "1"))
in
    #"Filtered Rows"
I then built up a report (shown top) of:
- treemap of sum amounts by parent capability
- line graph of sum amounts by month
- month slicer
- pie chart of sum amounts by parent capabilities
- pie chart of sum amounts by resource type
As default in Power BI I can interactively slice the data by clicking on each graph.