- Mark as New
- Bookmark
- Subscribe
- Mute
- Subscribe to RSS Feed
- Permalink
- Report Inappropriate Content
01-06-2022 02:17 PM
I desperately need some fresh eyes/guidance.
Our analysts are assigned catalog tasks with a due date, and project tasks with a planned end date. I have a formula indicator to capture their overall task completion rate. I need the results broken out by task assignee.
(([[MGA Count Catalog Tasks Closed On or Before Due Date]] + [[MGA Number of Closed Project Tasks On or Before Planned End Date]]) / ([[MGA Count Closed Catalog Tasks]] + [[MGA Number of Closed Project Tasks]])) * 100
The 4 automated indicators in the formula are included in a job collection which runs daily, and each indicator has the task assignee breakdown, as does the formula indicator itself.
There is a target of 90% completion of tasks on time for each analyst.
Our team lead would like to review the completion percentage of the analyst for the preceding month or week in their 1:1's relative to the target completion rate of 90%.
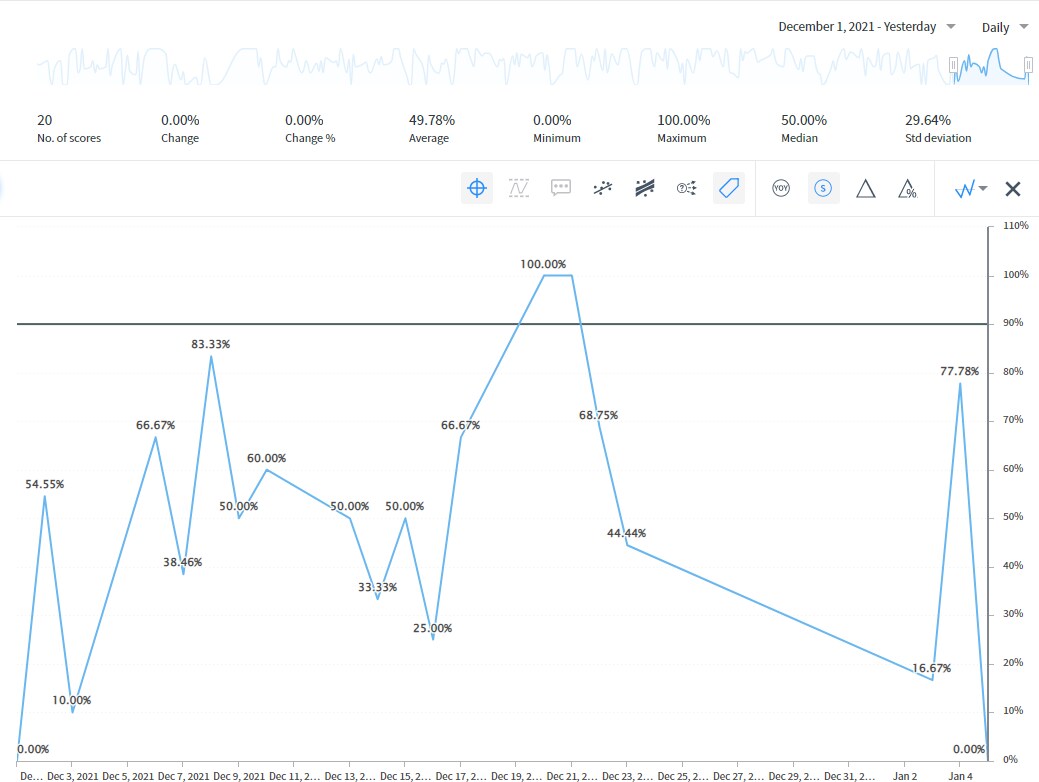
Per attached screenshot, if the date range is changed from daily to, for example, Dec. 1 to yesterday, an average of averages is rendered (995.63/20 = 49.78%) for that date range. This is similar to the case when applying a time series aggregation of running 30 day average to the indicator, where I'd expect an average of averages.
So if analyst Dave had 5 tasks due Monday and completed them all by their due date his completion rate is 100%. The next day he had one task due and didn't complete it by the due date for 0%. In instances like this we get an average of 50% (100%+0%/2=50%).
Crux of my question, what is the best way to see the percentage based on count (5/6*100=83.33%) for a given time range, and not an average of daily task completion percentage?
I'm looking for guidance on what I am doing wrong and sincerely hope I am missing something so obvious I'll be too humiliated to show my face here again.
Cheers in advance for any guidance.
Solved! Go to Solution.
- Labels:
-
Performance Analytics
-
Reporting
- Mark as New
- Bookmark
- Subscribe
- Mute
- Subscribe to RSS Feed
- Permalink
- Report Inappropriate Content
01-07-2022 04:50 AM
Hi Matt,
It sounds like you want the result that you would get by applying a 7-day or a 30-day running average time series aggregation, when the formula indicator has Apply time series to result unchecked. Please see Applying time series to result or to contributing indicators.
Unfortunately, I believe the Average statistic on the Analytics Hub (or in KPI Details) always applies the time series to the results on a formula indicator. It's not a bad idea to have it respect the value of Apply time series to result, and if you agree, perhaps you can suggest this in the Idea Portal.
In the meantime, I hope you might be able to use a time series aggregation applied to the contributing indicators instead of the result. Please let me know if this helps.
- Mark as New
- Bookmark
- Subscribe
- Mute
- Subscribe to RSS Feed
- Permalink
- Report Inappropriate Content
01-10-2022 02:21 PM
Jeff thanks so much for taking the time to answer my question - this is the way.
- Mark as New
- Bookmark
- Subscribe
- Mute
- Subscribe to RSS Feed
- Permalink
- Report Inappropriate Content
01-27-2025 01:27 AM
Hello guys
I had created everything and I am getting the results too.
But it is not updating daily because of that I am creating new indicators again and again and updating those in formula indicators do you have any solution for this.
To automate this which time series I need to use or Do I need to use the time series
But I want daily update historic is also fine
The below photos I did
Can you help me please?