Can you report on Project/Task Baseline Variance
- Mark as New
- Bookmark
- Subscribe
- Mute
- Subscribe to RSS Feed
- Permalink
- Report Inappropriate Content
06-18-2018 08:19 AM
Hi,
I am wanting to work with the Project/Task baseline dates
1. Want to report on/show where a project planned finish date i<> Baseline finish
2. Want to be able to show variance between the project baseline dates and the planned dates. I want to be able to have a threshold based on % Variance. For example if > 20% Variance then show red. Variance would be based on difference between baseline finish date and planned finish date as a % of Task Duration
I have built a table report that uses the Planned_Task_Baseline_Item table. Not sure if the above can be done in PA
Regards
Andrew
- Labels:
-
Performance Analytics
-
Reporting
- Mark as New
- Bookmark
- Subscribe
- Mute
- Subscribe to RSS Feed
- Permalink
- Report Inappropriate Content
06-18-2018 08:48 AM
Hi Andrew,
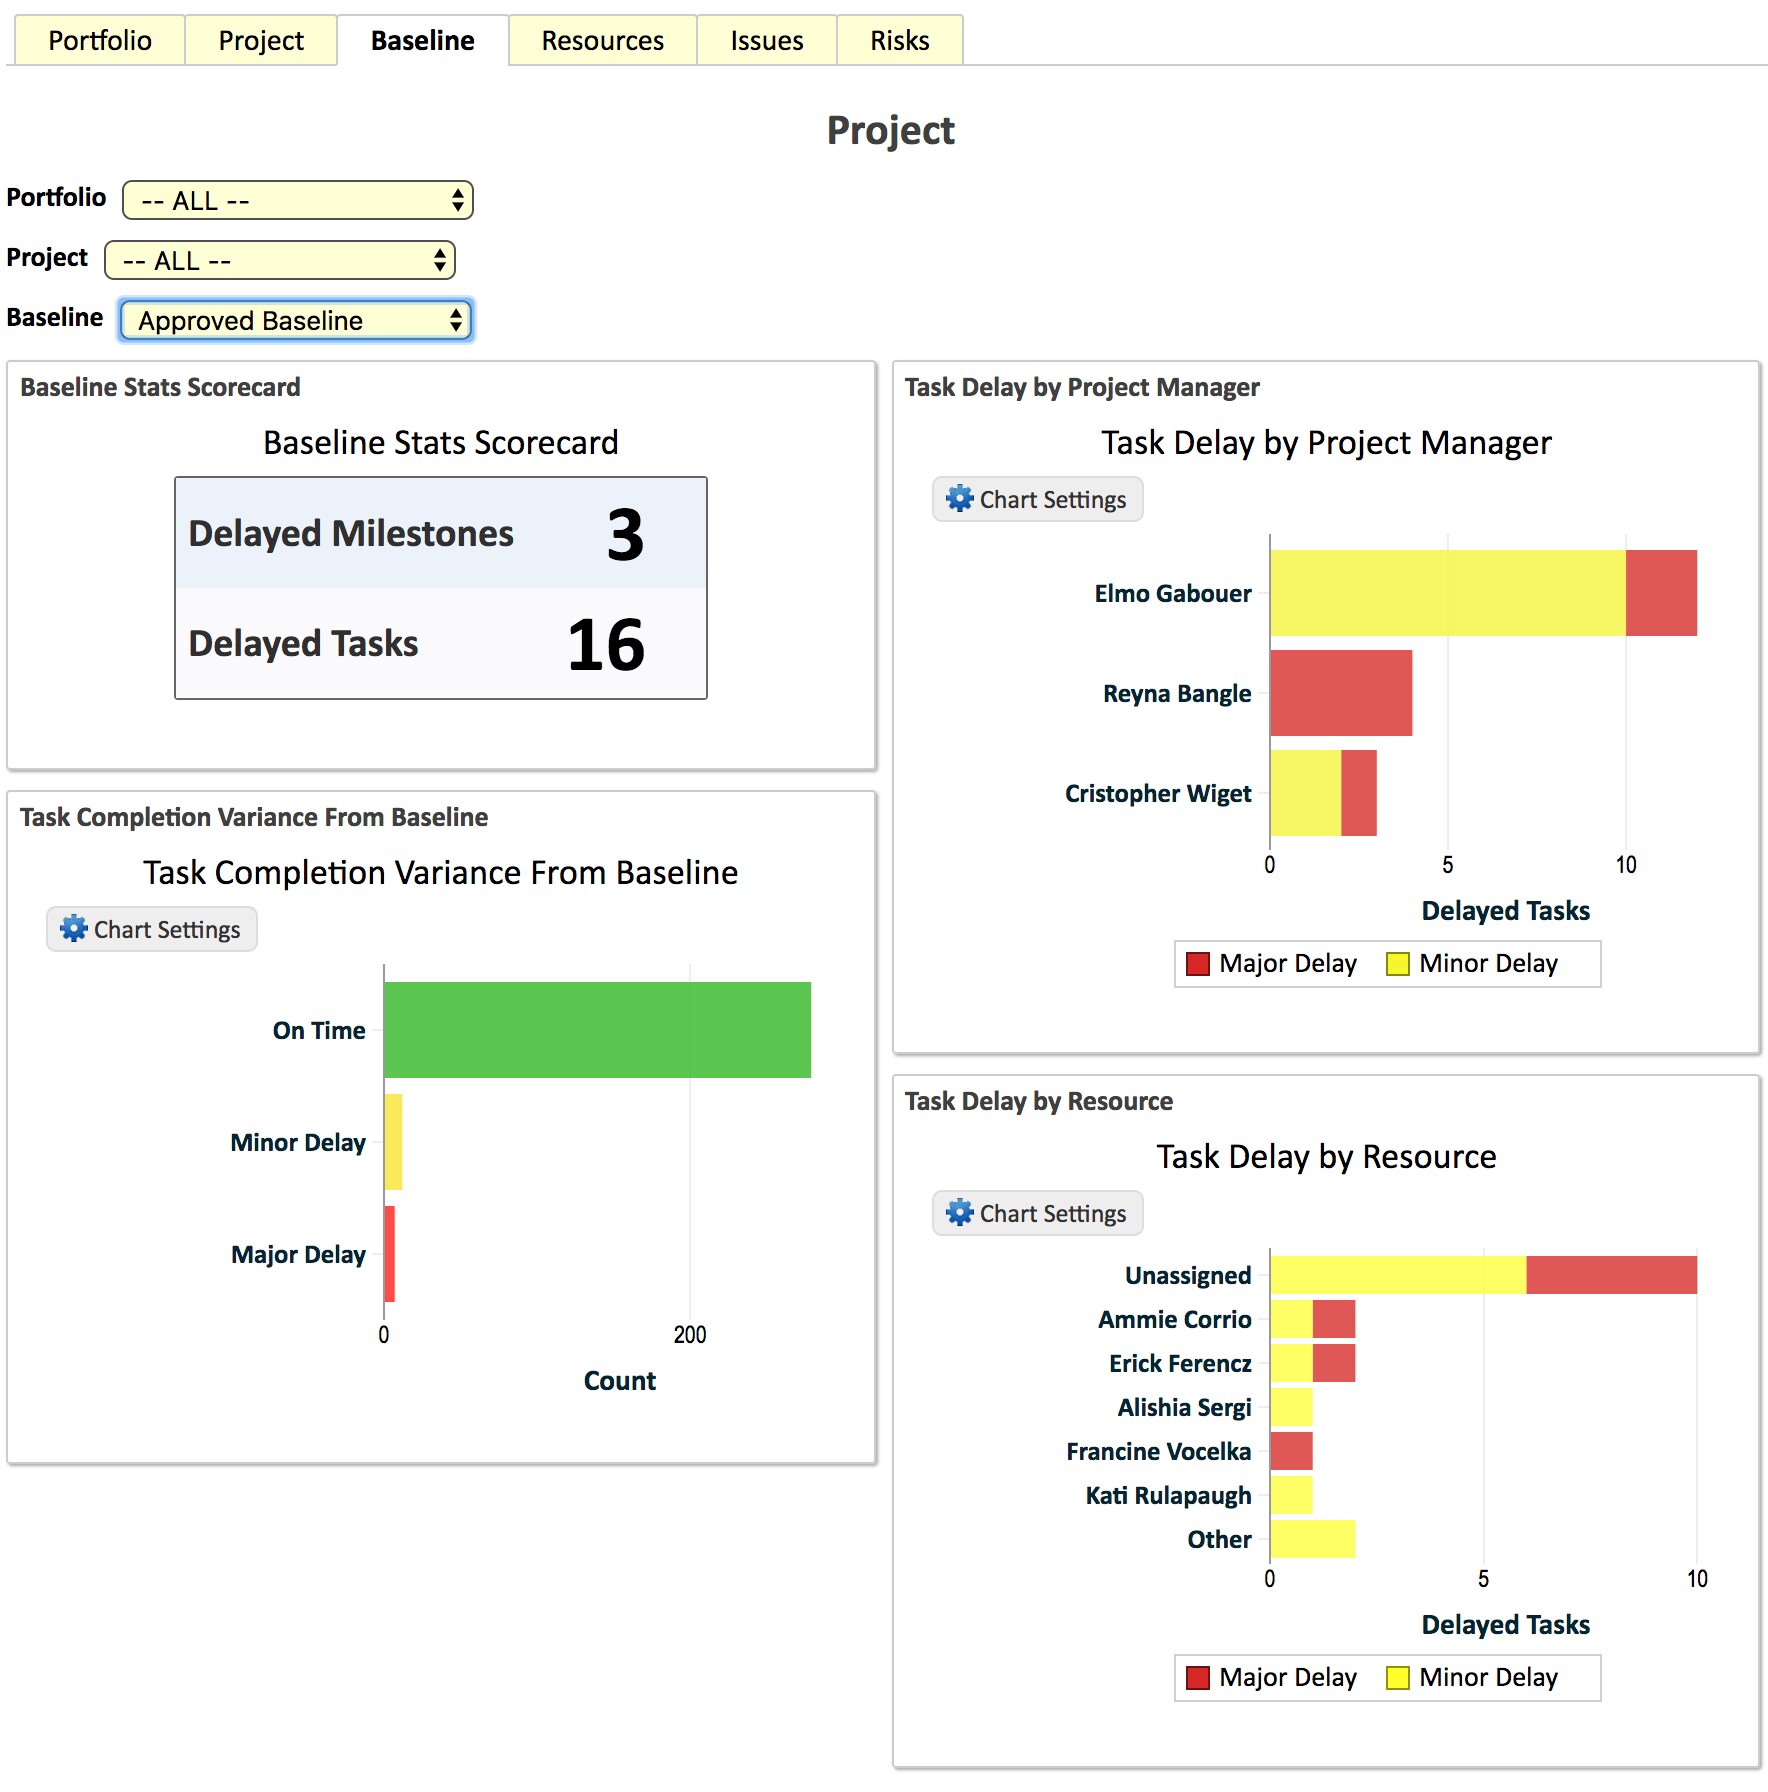
I'm not sure about Performance Analytics, but we do this with Explore Analytics. Here's a sample from our pre-built Project Management analytical application:

In the screenshot, rather than showing as a variance %, it's grouping it into buckets "on-time", "minor delay", and "major delay", but you could show it either way.
We have a webinar on the subject this friday if you want to learn more -- the reports are real-time, embeddable in ServiceNow or outside of ServiceNow, and it's all self-service / drag and drop set-up.
- Mark as New
- Bookmark
- Subscribe
- Mute
- Subscribe to RSS Feed
- Permalink
- Report Inappropriate Content
10-12-2020 09:18 AM
Hello! I am trying to gain access to the pre-built project management analytical application. How may I enable it from my EA account? I would also enjoy attending a webinar on it.
Theme Grenz
IT PMO Manager | Information Technology Services | Washington County
155 Main St | Public Services Building | Hillsboro, OR 97123
P: 503-846-8484
theme_grenz@co.washington.or.us