Change existing PA chart to show weekly totals instead of daily
- Mark as New
- Bookmark
- Subscribe
- Mute
- Subscribe to RSS Feed
- Permalink
- Report Inappropriate Content
08-11-2017 12:54 PM
An existing PA chart shows daily totals. How would I change it to show weekly totals instead? I'm new to PA so please be detailed in explanation.
- Labels:
-
Dashboard
-
Performance Analytics
- Mark as New
- Bookmark
- Subscribe
- Mute
- Subscribe to RSS Feed
- Permalink
- Report Inappropriate Content
08-11-2017 01:42 PM
Stephanie,
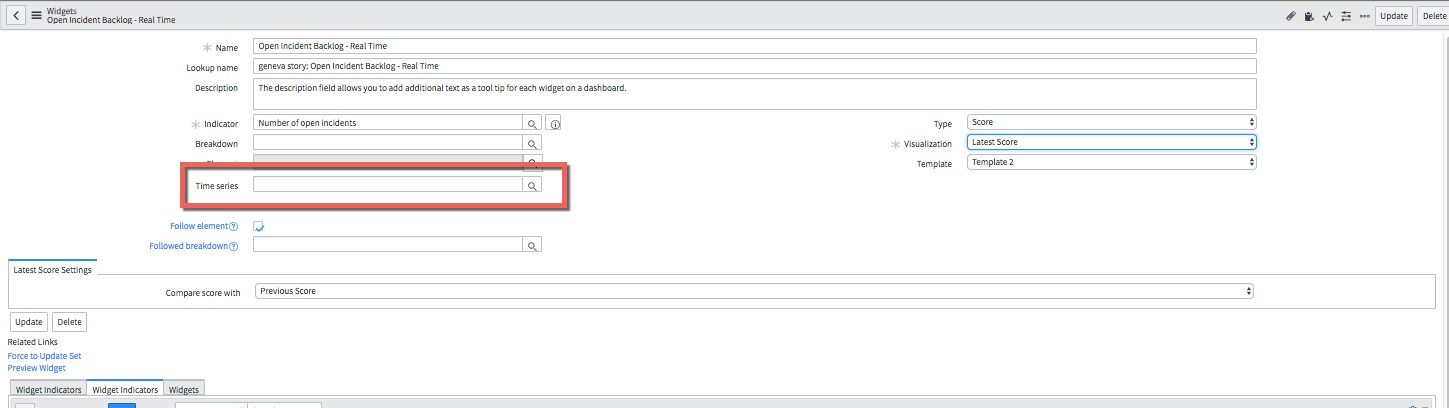
If you were to edit your PA widget (in this example I used a score widget) you should see an option to apply a time series. When selected, you will be presented with a number of options running sum, avg, ect....
One thing to note: Any time series selection that includes a + sign at the end, indicates values for the current week to date are being used, those time series options that do not have the trailing + indicate values from the previous week will be used.
Hope that helps......


- Mark as New
- Bookmark
- Subscribe
- Mute
- Subscribe to RSS Feed
- Permalink
- Report Inappropriate Content
08-13-2017 01:13 PM
I just wanted to expand on one thing that John said, and add one thing of my own.
Expanding on John regarding the + at the end, that took me for freakin' ever to figure out. The + indicates that partial time periods will be included. For example, let's say you have measurements on some indicator for April 15 through August 13. If you select a time series of "by month +", it will include partial reporting periods. You'll have five data points:
- April 15 - April 31
- May 1 - May 31
- June 1 - June 30
- July 1 - July 31
- August 1 - August 13
On the other hand, if you select a time series of "by month" (without the plus), it will NOT include partial reporting periods. You'll have three data points, because you only have three whole months of reporting data. The data for April 15 - April 31 and August 1 - August 13 is not included:
- May 1 - May 31
- June 1 - June 30
- July 1 - July 31
In general, if your indicator is a SUM, you will probably not want partial reporting periods, since the current period will be skewed lower than all your other data points, the magnitude of which will depend on where in your period you are. At the beginning of the month (or week, or quarter, or whatever), the more skewed downward it will be. If your indicator is an AVG, you may want partial reporting periods, but with the understanding that because it's incomplete data, your most recent data point will be more volatile and subject to being off to true than reporting in months past; it should be considered a ballpark figure at best.
The thing I wanted to add is that you shouldn't make the same newbie mistake I did when I started digging into Performance Analytics. There is a field when you create a new indicator labeled "Frequency," and you can set it to Daily, Weekly, Bi-Weekly, Monthly, etc. This is NOT the field you're looking for to accomplish what you're trying to do. That field specifies the interval at which the collector will run, not the roll-up period you want to see your data. Unless you have a compelling reason and really know what you're doing, always leave the Frequency set to daily so that your collector will run every day.
As John said above, if you want to see your data rolled up by week, month, quarter, or some other period, the field(s) you're looking for are the ones called some variation of "time series".
Hope this helps,
--Dennis R
- Mark as New
- Bookmark
- Subscribe
- Mute
- Subscribe to RSS Feed
- Permalink
- Report Inappropriate Content
08-14-2017 08:07 AM
Denis - thanks so much for the additional detail. It's always good to be nudged away from newbie mistakes.
- Mark as New
- Bookmark
- Subscribe
- Mute
- Subscribe to RSS Feed
- Permalink
- Report Inappropriate Content
08-14-2017 08:05 AM
Thanks for the detailed response!
I had found the Time series but didn't see any results - do I also need to re-execute the daily and historic jobs.
Thanks also for explaining those plus signs on the time series options!