Change the default "group by" for a report
- Mark as New
- Bookmark
- Subscribe
- Mute
- Subscribe to RSS Feed
- Permalink
- Report Inappropriate Content
07-27-2017 02:39 AM
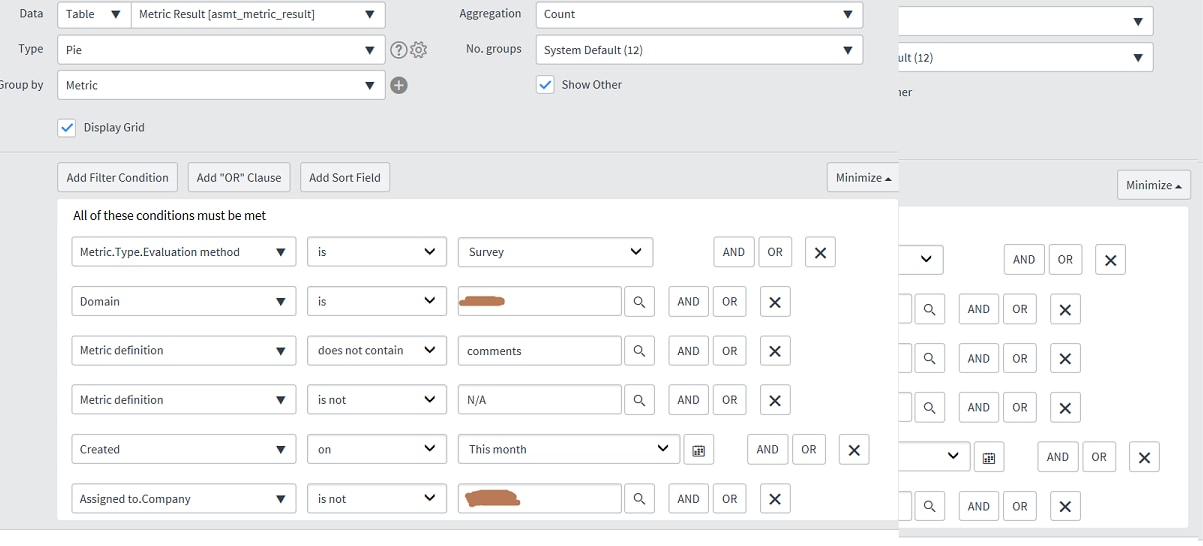
On our Helsinki system, we have a report on our customer satisfaction surveys which is defined as follows:

When we run the report, we see our pie chart, as expected:

In the box below the graph as shown, is a drop-down list with two options in it, "Metric" (the default) and "String value". Selecting the "String value" option gives us the data we really want, which is the percentage of "Strongly agree", "Agree", etc, answers to the survey questions:

This works fine when we run the report manually, but what we actually want to do is to schedule the report, and email the chart as a PDF. Obviously when we do this, what we get is the default grouping option of "Metric". We need to have "String value" as the default grouping option, but "String value" does not appear in the list of grouping options in the "Group By" list in the report definition!
Can anyone help us obtain the result we want, and get a report which is grouped by "String value" by default, please?
Many thanks,
Chris
- Mark as New
- Bookmark
- Subscribe
- Mute
- Subscribe to RSS Feed
- Permalink
- Report Inappropriate Content
07-28-2017 03:41 AM
Cheers, Dave. I've opened a ticket on HI, so we'll see what ServiceNow have to say.
Thanks again for your kind assistance.
Chris
- Mark as New
- Bookmark
- Subscribe
- Mute
- Subscribe to RSS Feed
- Permalink
- Report Inappropriate Content
11-13-2017 12:39 PM
Hi Chris, what was the result of your HI ticket? We are experiencing the same issue in Jakarta.
- Mark as New
- Bookmark
- Subscribe
- Mute
- Subscribe to RSS Feed
- Permalink
- Report Inappropriate Content
06-16-2020 06:34 AM
Hi Chris,
What was the solution for this. I have a similar issue.
- Mark as New
- Bookmark
- Subscribe
- Mute
- Subscribe to RSS Feed
- Permalink
- Report Inappropriate Content
12-07-2020 03:53 PM
Also having a very similar issue, and curious what HI support concluded.
