Group by Month on a Heat map
- Mark as New
- Bookmark
- Subscribe
- Mute
- Subscribe to RSS Feed
- Permalink
- Report Inappropriate Content
10-29-2018 02:38 PM
I've been tasked to create a heat map that will show assignment groups for rows and Month closed for Columns. The aggregation is the average Resolve time. The issue is that I cannot Group by Month so the report has dates and time along the X axis. How can I group by month without performing an invasive change like adding a field to a table?
Running Jakarta at the moment.
- Labels:
-
Reporting
- Mark as New
- Bookmark
- Subscribe
- Mute
- Subscribe to RSS Feed
- Permalink
- Report Inappropriate Content
10-29-2018 05:38 PM
The way to get this to work the fastest is to add a column to your table that sets the month. Alternatively, use Performance Analytics which will show you this as well (and a lot more). This may be in the Performance Analytics for Incident (which is included for all ServiceNow Customers). You may just have to add a widget (visualization on an existing indicator).
- Mark as New
- Bookmark
- Subscribe
- Mute
- Subscribe to RSS Feed
- Permalink
- Report Inappropriate Content
10-30-2018 07:39 AM
I'll have to see if anyone in my organization can perform these suggestions. We shy away from customization and I have no idea what a widget is.
Thank you for your help.
- Mark as New
- Bookmark
- Subscribe
- Mute
- Subscribe to RSS Feed
- Permalink
- Report Inappropriate Content
10-30-2018 07:54 AM
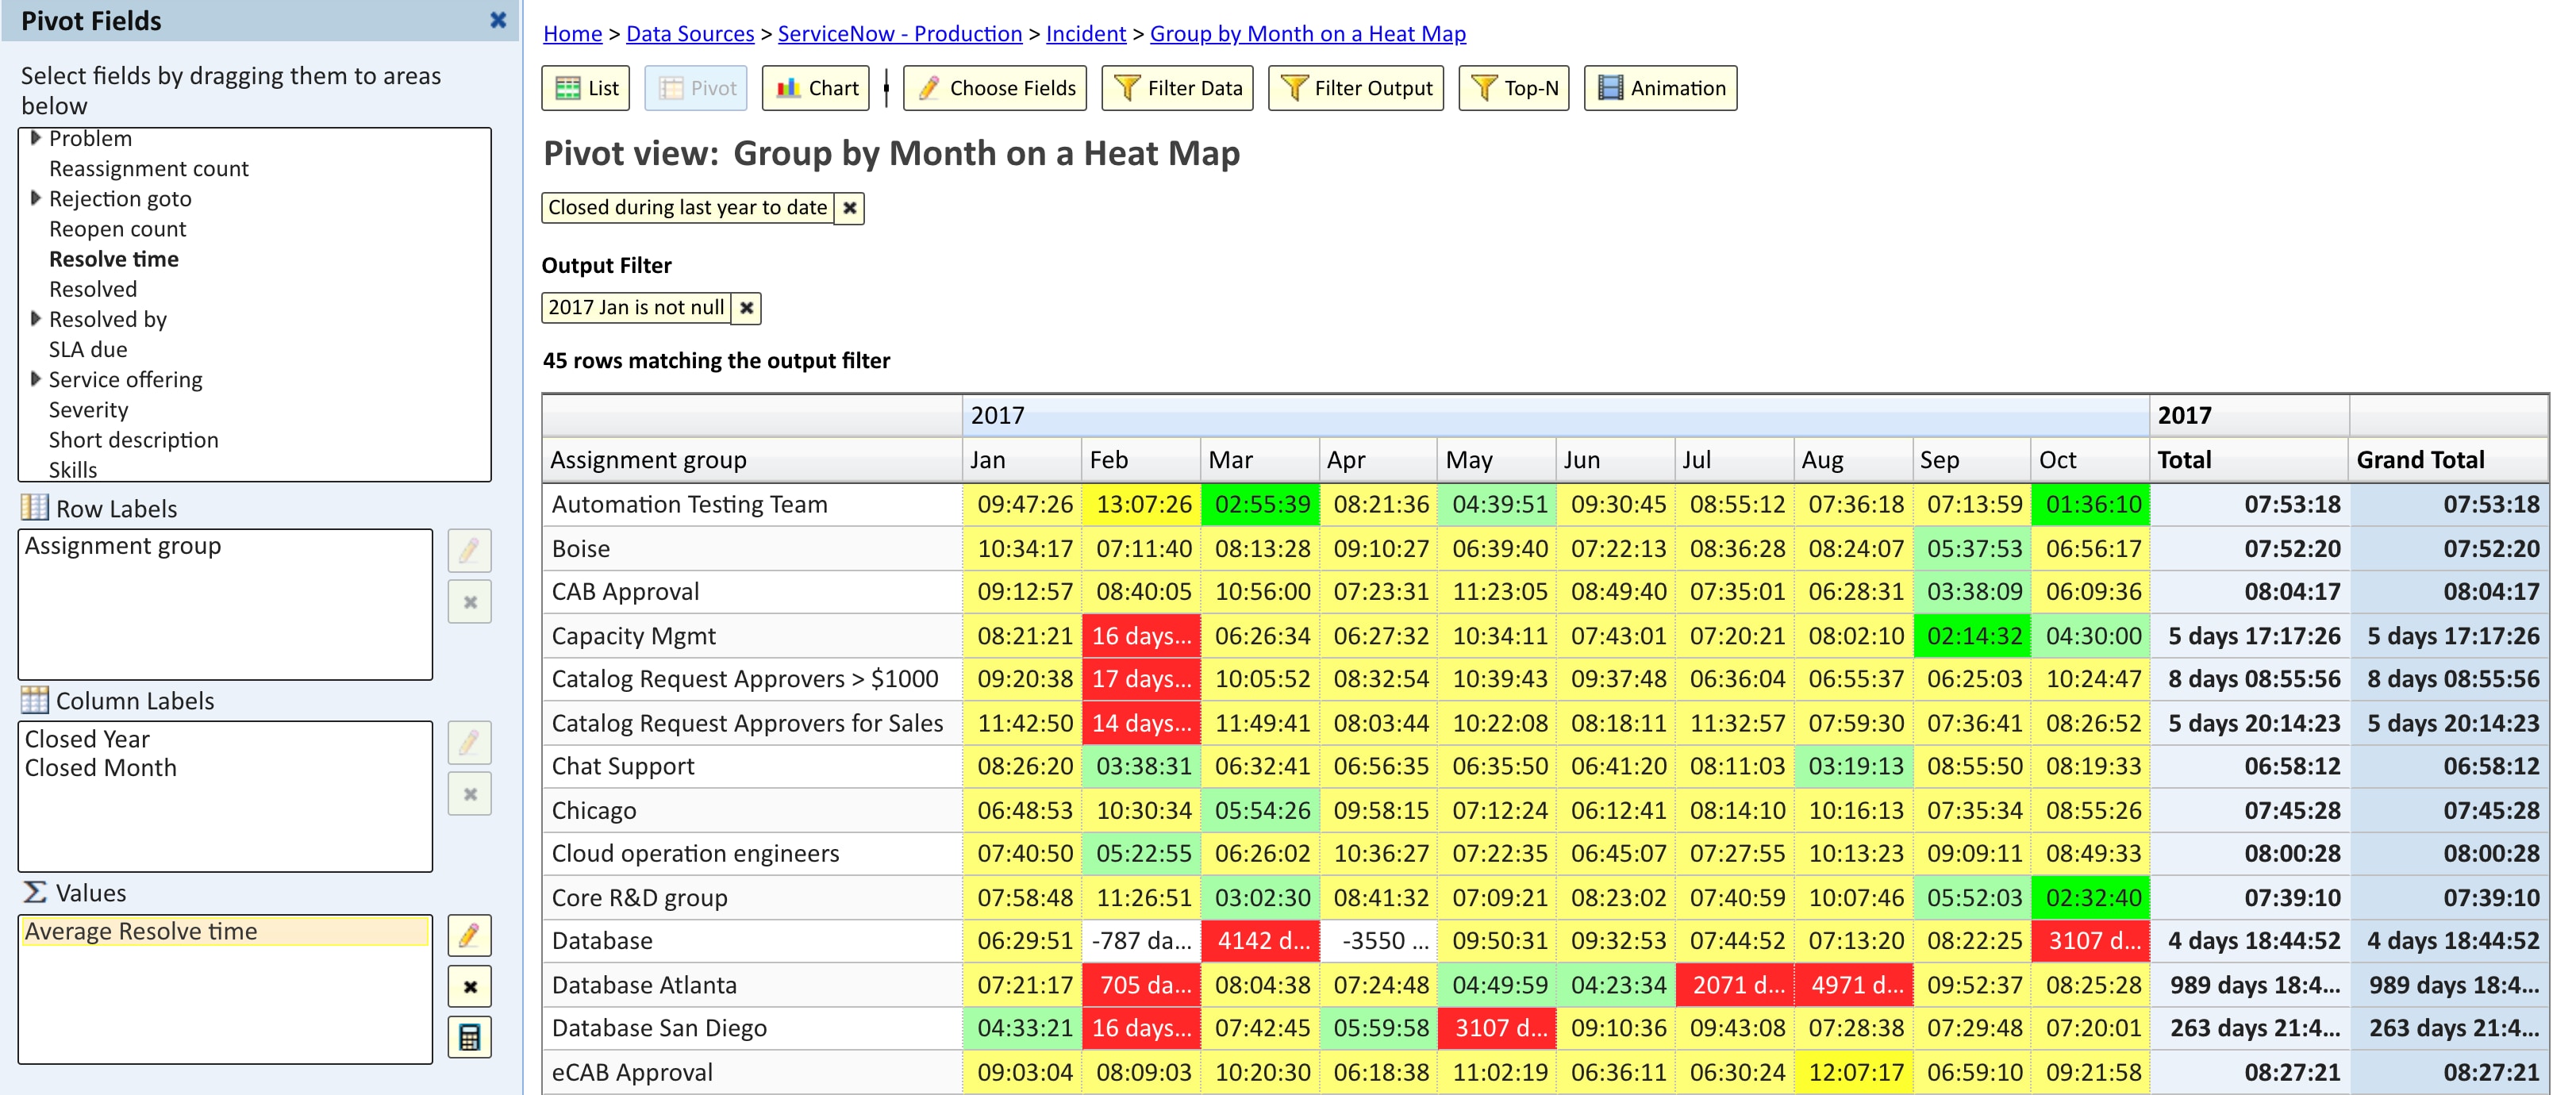
Is this what you mean from a heat map - Year and Month in the X axis, Assignment group in the rows, and average resolve time in the values, with coloring rules to highlight the resolve time based on ranges?:

This is created using Explore Analytics, a drag-and-drop reporting tool natively integrated with ServiceNow. It's real-time, it's drillable, and can be embedded in the ServiceNow dashboard or presented in other portals.
- Mark as New
- Bookmark
- Subscribe
- Mute
- Subscribe to RSS Feed
- Permalink
- Report Inappropriate Content
10-30-2018 08:41 AM
That is what I'm looking for via the built-in reporting tools. I don't have enough clout to make changes to the system or buy software, but that is what I'm looking for in my question.
I know that you can group by month in other forms of a report but it's called Trend by Month.