How do I create a stacked column report in performance analytics
- Mark as New
- Bookmark
- Subscribe
- Mute
- Subscribe to RSS Feed
- Permalink
- Report Inappropriate Content
04-14-2017 07:25 AM
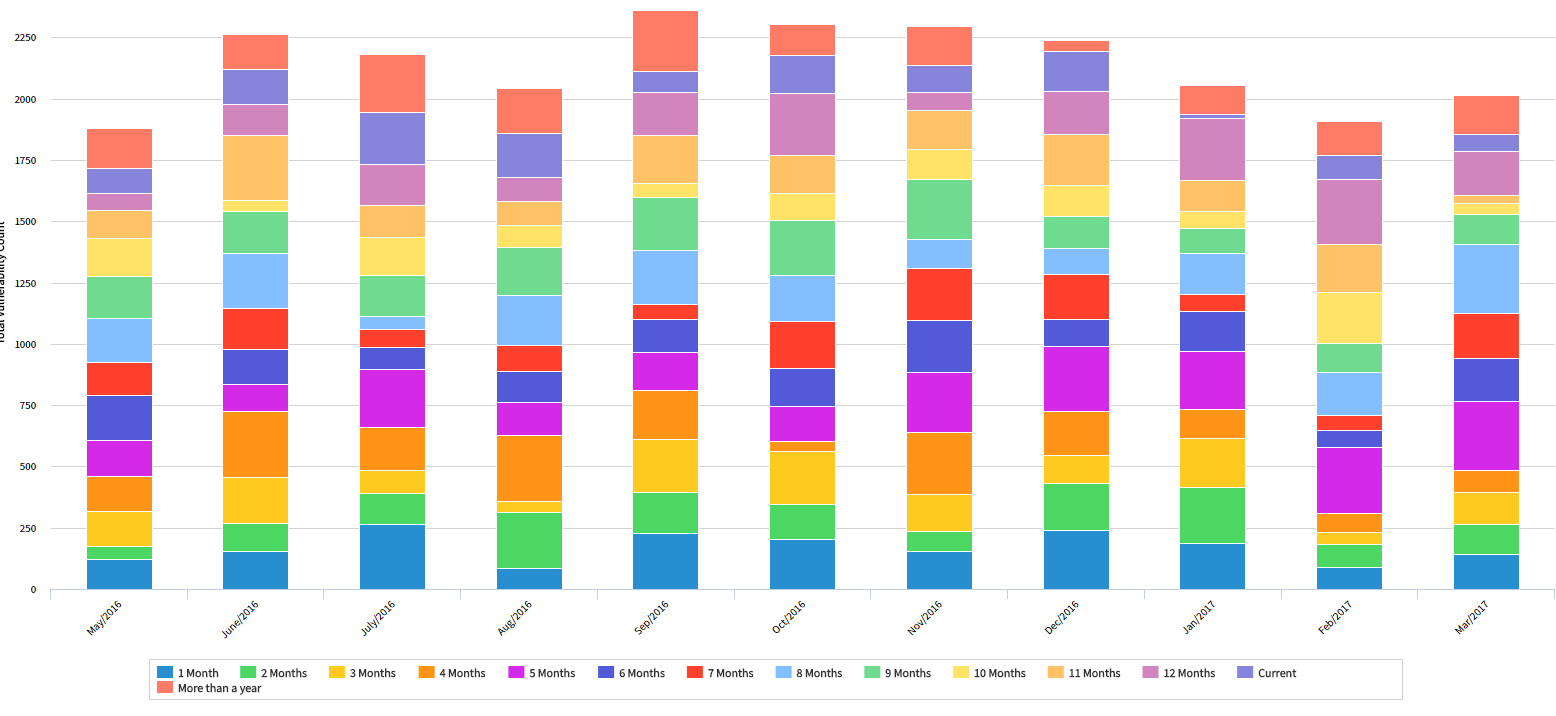
I'm specifically trying to work with the Vulnerable Item table but I think the concept would be fine either way. I've written a script, table and report that can take a snapshot of that table to give me the number of vulnerabilities and stack them based on how many months overdue they are. It runs at the beginning of the month and stores the aggregate data in my own table that I can easily report off of. I'd like to use Performance Analytics directly against the Vulnerable Item table to do the same.
I've created indicators, breakdowns and their sources but can't seem to break the data down properly to get a stacked column for the current snapshot in time. Can someone help me figure out how to build this thing? Not looking for historical or trend data right now, just how to get the current snapshot to stack on any field so I can figure out the script to stack it on months overdue.
Good report:

PA Report:

Thanks
Dan
- Labels:
-
Performance Analytics
-
Reporting
- Mark as New
- Bookmark
- Subscribe
- Mute
- Subscribe to RSS Feed
- Permalink
- Report Inappropriate Content
04-14-2017 12:05 PM
Try using a widget with type "breakdown" and visualization "stacked column" , put in your indicator name and the breakdown name and time series of "by month sum+"
- Mark as New
- Bookmark
- Subscribe
- Mute
- Subscribe to RSS Feed
- Permalink
- Report Inappropriate Content
04-14-2017 01:20 PM
I just tried that again, and it actually makes the report show no data at all.
Lets just assume this example wants to stack by severity. Here's what I've done so far.
Indicator Source: Vulnerable Item with the conditions I care about. Preview gives me 2000+ rows with varying severities
Breakdown Source: Facts table is Vulnerable Item with a field of sysid filtered with severity > 3. I honestly have no idea how this would breakdown by severity but I'm just following the demo data and hoping this is what creates the stack.
Breakdown: Uses the breakdown source above and has a mapping to vulnerable item qualys severity field.
Indicator: Unit #, source is indicator above, aggregtate: count, breakdown as above and on a daily job
Widget: Indicator and breakdown as above, type breakdown, visualization stacked column
When adding the widget to the dashboard, it says no data is returned, but when the job is run, it inserts two records. Is there some table I can look in to see what the data was that got created by the job? Am I going about trying to stack these columns wrong?
- Mark as New
- Bookmark
- Subscribe
- Mute
- Subscribe to RSS Feed
- Permalink
- Report Inappropriate Content
04-17-2017 10:12 AM
HI Dan,
First you would have to create the breakdown by severity , follow the instructions here to create the correct breakdown Define a breakdown source
Then you re-run the job and collect the scores , once the job runs without errors
Go to Performance analytics -> scoresheet and find your indicator and see if the data is actually broken down by the breakdown you just created.
Once you confirm scores are collected against the breakdown you can create your widget to visualize the data
- Mark as New
- Bookmark
- Subscribe
- Mute
- Subscribe to RSS Feed
- Permalink
- Report Inappropriate Content
04-18-2017 08:37 AM
FYI, my issue was my breakdown sources weren't correct. I ended up having to create a new bucket group for my time slices and use that in my breakdown source. Doing that and seeing that I can see my data pulled down by the PA job in the scoresheet helped me figure everything else out.