- Mark as New
- Bookmark
- Subscribe
- Mute
- Subscribe to RSS Feed
- Permalink
- Report Inappropriate Content
08-13-2018 05:35 AM
Hi All,
I would like to know the trend of list of active incidents every week by using PA. I have been informed form SNOW HI team that this can be achieved by Performance Analytics and standalone reports can't support this as it requires the history of data.
Please suggest which report in PA free version can be used
Solved! Go to Solution.
- Labels:
-
Dashboard
-
Performance Analytics
-
Reporting
- Mark as New
- Bookmark
- Subscribe
- Mute
- Subscribe to RSS Feed
- Permalink
- Report Inappropriate Content
09-12-2018 03:05 AM
Hi,
You can use free OOTB Incident dashboards : https://docs.servicenow.com/bundle/london-it-service-management/page/use/dashboards/application-content-packs/incident-content-pack.html
To enable the solution for Incident Management, an admin can navigate to Performance Analytics > Guided Setup. Click Get Started then scroll to the section for Incident Management. The guided setup takes you through the entire setup and configuration process.
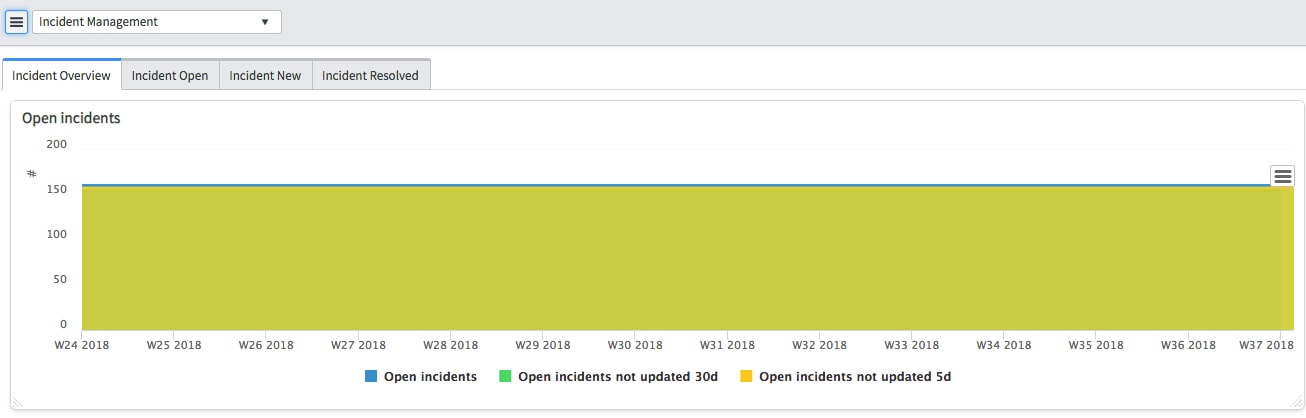
Above, a screenshot of the OOTB "Incident management" dashboard after setup :

For example, "Open incidents" OOTB indicator can show you the trend of unresolved incidents over time (by day default).
You can edit the widget to trend by week instead of by day with time series "field" :

The result is now trend by week :

If this response answered your question, please mark your question as answered. If you found it helpful, please mark the response as helpful
- Mark as New
- Bookmark
- Subscribe
- Mute
- Subscribe to RSS Feed
- Permalink
- Report Inappropriate Content
09-12-2018 03:05 AM
Hi,
You can use free OOTB Incident dashboards : https://docs.servicenow.com/bundle/london-it-service-management/page/use/dashboards/application-content-packs/incident-content-pack.html
To enable the solution for Incident Management, an admin can navigate to Performance Analytics > Guided Setup. Click Get Started then scroll to the section for Incident Management. The guided setup takes you through the entire setup and configuration process.
Above, a screenshot of the OOTB "Incident management" dashboard after setup :
For example, "Open incidents" OOTB indicator can show you the trend of unresolved incidents over time (by day default).
You can edit the widget to trend by week instead of by day with time series "field" :
The result is now trend by week :
If this response answered your question, please mark your question as answered. If you found it helpful, please mark the response as helpful
- Mark as New
- Bookmark
- Subscribe
- Mute
- Subscribe to RSS Feed
- Permalink
- Report Inappropriate Content
09-12-2018 05:46 AM
Could you not just create a Bar or Trend report based on "Updated" field on incident?
- Mark as New
- Bookmark
- Subscribe
- Mute
- Subscribe to RSS Feed
- Permalink
- Report Inappropriate Content
09-12-2018 06:00 AM
With trend chart report you cannot get all historical data requested : display the number of active incidents every week, you need PA to collect historical data.
- Mark as New
- Bookmark
- Subscribe
- Mute
- Subscribe to RSS Feed
- Permalink
- Report Inappropriate Content
11-02-2025 07:48 AM
@sk59, how did you achieved this? I have same requirement