Is there a way to stack columns in a report with multiple data sets?
Options
- Mark as New
- Bookmark
- Subscribe
- Mute
- Subscribe to RSS Feed
- Permalink
- Report Inappropriate Content
05-08-2018 06:45 AM
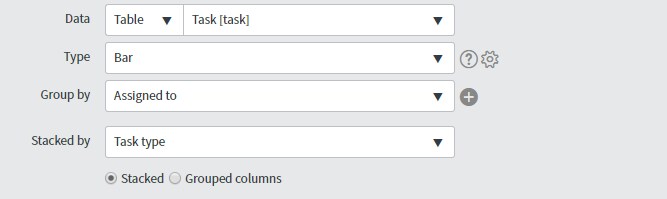
I've created the report below, which shows the active Tasks and Incidents assigned to the technicians on my team.
Is there a way to stack the Incidents on top of the Tasks, so that I see only one bar (with two colors) per technician? Whenever I try to use "Stacked by", selecting either "Stacked" or "Grouped Columns", it just fouls up the colors and labels.

1 REPLY 1
Options
- Mark as New
- Bookmark
- Subscribe
- Mute
- Subscribe to RSS Feed
- Permalink
- Report Inappropriate Content
07-30-2018 10:06 PM
