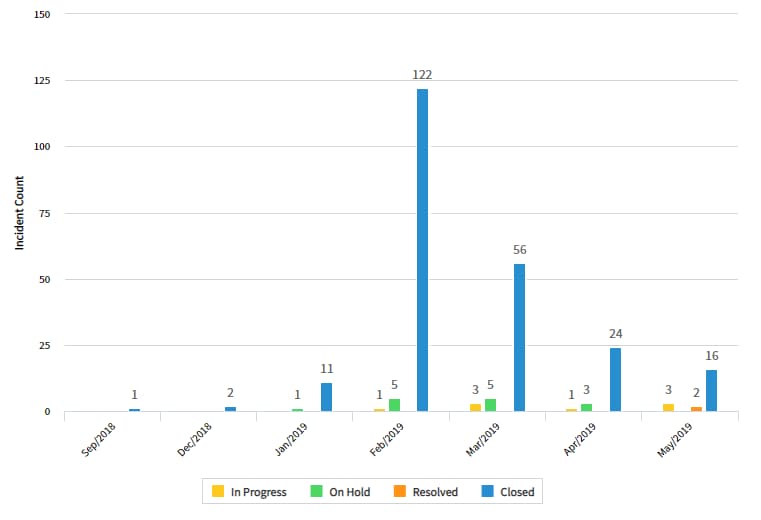
Open vs closed incidents but with total numbers per month
- Mark as New
- Bookmark
- Subscribe
- Mute
- Subscribe to RSS Feed
- Permalink
- Report Inappropriate Content
05-17-2019 06:45 AM
Hello Community,
I hope this is the right place for my first question.
I have browsed all kinds of answers about a report that shows open vs closed tickets and I have made a good one myself, but it's not perfect and that's why I need help.
I want a report that shows per month the total of tickets per state. The one I have now shows not the total, but the (created?) in that month.
Data that should show:
In progress = 8
Resolved = 2
On Hold = 14
Closed = 200+
Data it shows, e.g. May:
In progress: 3
Resolved: 2
Closed: 16

* Thinking about leaving Closed tickets out, because they are 200+ and will give a "disturbed" view
Settings for my report now:
- Source Type = Table
- Table = Incidents
- Type = Column, because I want per month
- Group by = State
- Grouped Bars
- Trend by = Created (don't know which esle...)
- Per: Month
- Aggregation = Count
- Filter = 1 particular Assignment group
Please help.
Thank you!
- Labels:
-
Reporting
- Mark as New
- Bookmark
- Subscribe
- Mute
- Subscribe to RSS Feed
- Permalink
- Report Inappropriate Content
05-17-2019 10:23 AM
You need to use multiple data sets for your report to achieve this requirement.
Regards,
Sachin
- Mark as New
- Bookmark
- Subscribe
- Mute
- Subscribe to RSS Feed
- Permalink
- Report Inappropriate Content
05-20-2019 12:08 AM
Thank you, this gave me a good insight. But unfortunately, Performance Analytics premium is not enabled at the moment, because I don't have that option next to Save ((as shown here). I will have a look at that if it's possible to enable.
- Mark as New
- Bookmark
- Subscribe
- Mute
- Subscribe to RSS Feed
- Permalink
- Report Inappropriate Content
05-17-2019 10:59 AM
Hello vera, Check this out
https://community.servicenow.com/community?id=community_question&sys_id=a3bdc76ddb9cdbc01dcaf3231f961919
Mark Correct if this solves your issue and also mark Helpful if you find my response worthy. Thanks, Ruhi.
- Mark as New
- Bookmark
- Subscribe
- Mute
- Subscribe to RSS Feed
- Permalink
- Report Inappropriate Content
05-20-2019 12:12 AM
Thank you, but that didn't make a difference. I added the conditions mentioned in the first reply. I did had to add my Assignment group to both conditions, because it gave the wrong image. But doing so, it got back to the same numbers as mentioned before.
Can you help me further or do I need that extra dataset as mentioned by Sachin?