Performance analytics indicator problem
- Mark as New
- Bookmark
- Subscribe
- Mute
- Subscribe to RSS Feed
- Permalink
- Report Inappropriate Content
06-12-2025 09:31 PM
Hello,
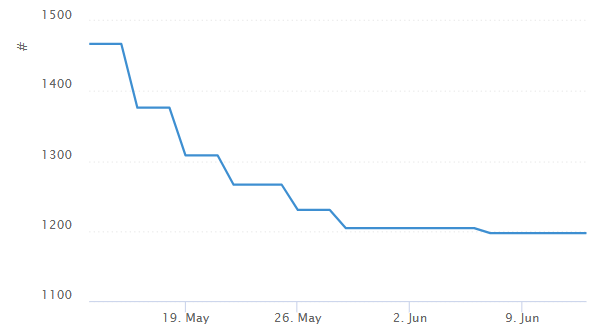
I started collecting Warranty expiration for mobile devices recently and wanted to present this as a trend how I managed to update the missing warranty since I started. When I started the missing were about 9000, today they are 2400. In the result it shows I am starting from 1750, which is not correct. It should start from 9000 and going down. However for some reason it is not showing. could anyone help, please.
Thanks
- Mark as New
- Bookmark
- Subscribe
- Mute
- Subscribe to RSS Feed
- Permalink
- Report Inappropriate Content
06-13-2025 12:34 PM
Hi @Todor Kotsev ,
I don't get what you are trying to collect. What is the data range that you're looking at? I can see from the result that it starts from some time in March to current date - is this as expected?
If my answer has helped with your question, please mark my answer as the accepted solution and give a thumbs up.
Best regards
Anders
Rising star 2024
MVP 2025
linkedIn: https://www.linkedin.com/in/andersskovbjerg/
- Mark as New
- Bookmark
- Subscribe
- Mute
- Subscribe to RSS Feed
- Permalink
- Report Inappropriate Content
06-13-2025 08:06 PM
Hi, I am trying to collect the warranty expiration dates on alm_asset table tracked over time. So when I started there were 9000 assets that without warranty info. Over the time i have inserted the dates the missing score has dropped. So it should pick up the scores of missing Warranty over time 9000, 7000, 6599,5000 and so on.
- Mark as New
- Bookmark
- Subscribe
- Mute
- Subscribe to RSS Feed
- Permalink
- Report Inappropriate Content
06-14-2025 11:18 PM
Hi @TodorK ,
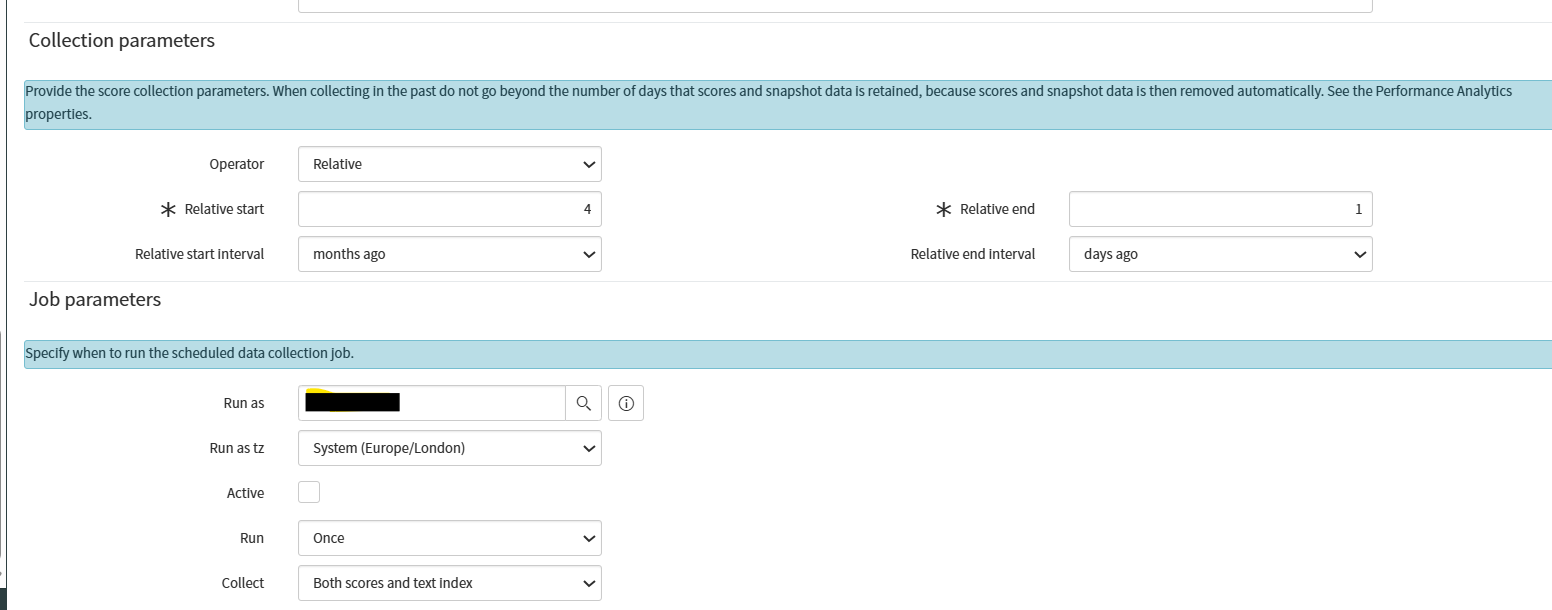
Ok, so if I understand you correctly, the warranty data information that you're missing you're inserting manually, and you want to know how many you're missing and how many you have added in our time since you're utilizing performance analytics - correct? If yes, can you please share how you have configured your scheduled job?
If my answer has helped with your question, please mark my answer as the accepted solution and give a thumbs up.
Best regards
Anders
Rising star 2024
MVP 2025
linkedIn: https://www.linkedin.com/in/andersskovbjerg/
- Mark as New
- Bookmark
- Subscribe
- Mute
- Subscribe to RSS Feed
- Permalink
- Report Inappropriate Content
06-15-2025 05:17 AM
Hi,
I am getting the warranty dates from the Service owners and populating the assets with given dates, so every time I insert missing warranty I would expect the PA graph to be going down, where as i just gives me the current missing Warranty. I want the graph to be like on the picture 'graph'. I have also attached the daily job and historic job (which I ran only once). But the historic job does not get historic values, as I expect the missing warranty to be 9000 one month ago, then I have inserted few thousand from then. It should be 9000, 8500, 7000, 5000 etc shown on a graph.
Thanks