How can we measure hours of downtime?
- Mark as New
- Bookmark
- Subscribe
- Mute
- Subscribe to RSS Feed
- Permalink
- Report Inappropriate Content
03-14-2016 01:34 AM
- Mark as New
- Bookmark
- Subscribe
- Mute
- Subscribe to RSS Feed
- Permalink
- Report Inappropriate Content
03-15-2016 07:24 AM
Hi Oana,
This depends on the way it is stored in ServiceNow. If you use the outages table/module in ServiceNow, you could use performance analytics to calculate the outage per service and calculate for instance the percentage of availability, or the hours of down time on any given day.
Cheers,
Vincent
- Mark as New
- Bookmark
- Subscribe
- Mute
- Subscribe to RSS Feed
- Permalink
- Report Inappropriate Content
03-15-2016 12:46 PM
With Explore Analytics, you can get live reporting or historical reporting to calculate the length and impact of outages. For example, this report:

This is a live, interactive report embedded in the ServiceNow dashboard, that's showing the % Uptime and the Mean Time Between Failures based on the duration of the outage. (You can also generate it as a difference between two date-times).
The Uptime calculation looks like this:
In that example, we're automatically rolling up incidents that are associated to individual CIs to their upstream business service, something no other reporting can do.
So for example in this report, you can see the outages that are opened against individual CIs (ALDWXP and DC01) impact upstream services (Bond Trading, Uber Service).

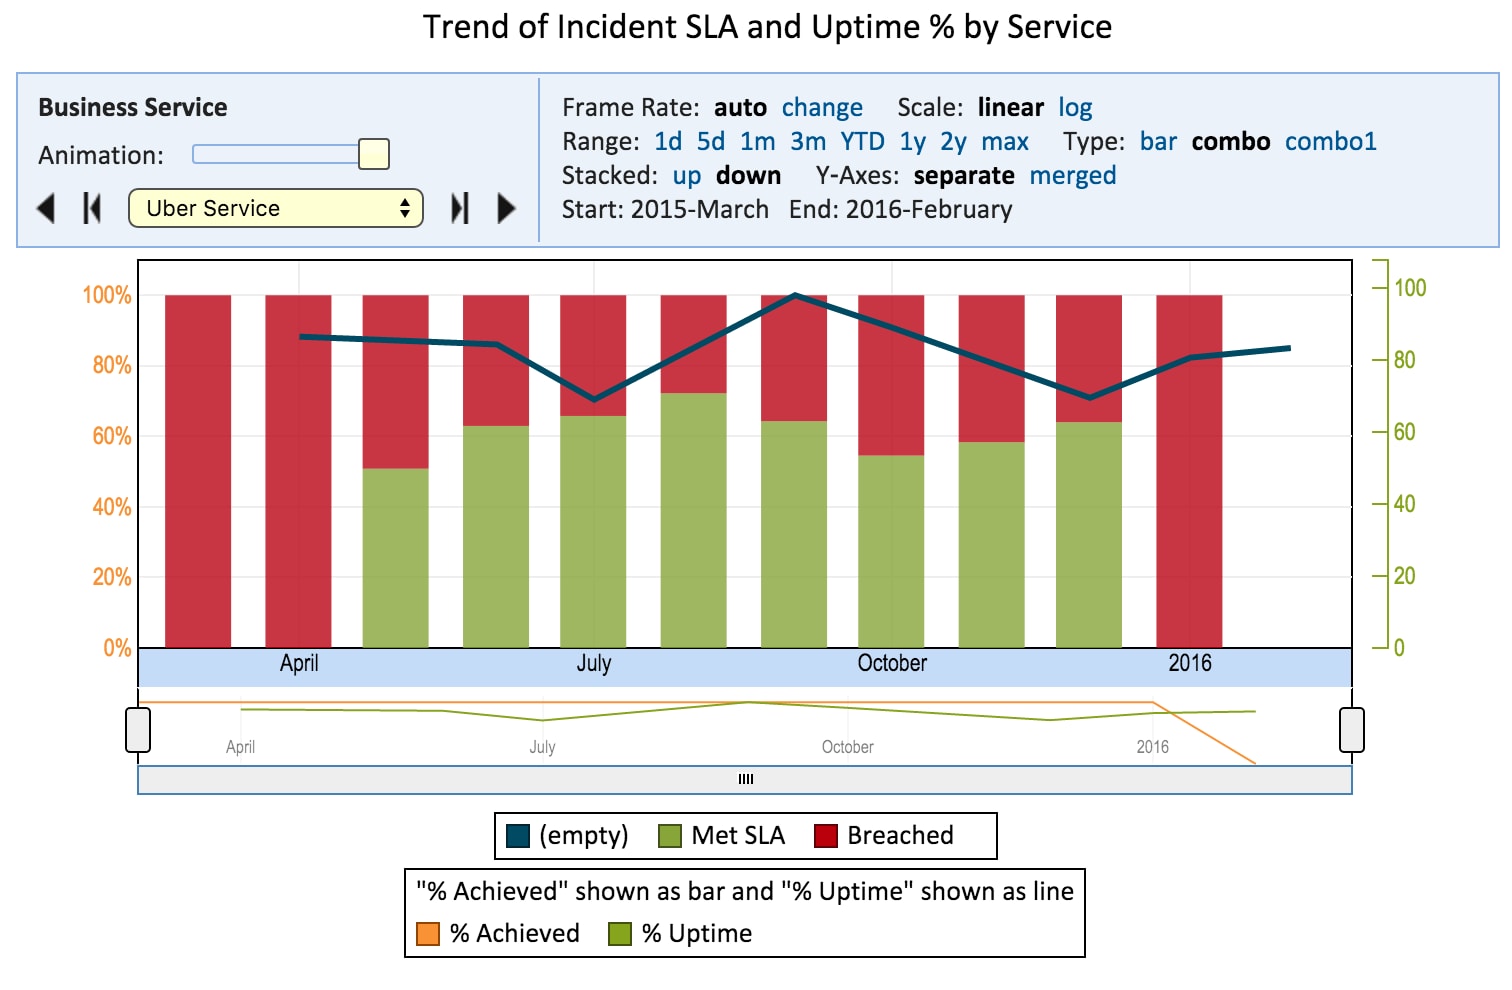
Explore Analytics can also combine information from multiple tables, like this report combining the % of tasks meeting SLA with the % availability of the same service:

- Mark as New
- Bookmark
- Subscribe
- Mute
- Subscribe to RSS Feed
- Permalink
- Report Inappropriate Content
06-15-2025 09:09 PM
To measure hours of downtime, you can follow these key steps:
Manual Method (Paper/Spreadsheet)
Log Downtime Events: Record the start and end time of each equipment or system failure.
Calculate Downtime:
Downtime (hours)=End Time−Start Time\text{Downtime (hours)} = \text{End Time} - \text{Start Time}Downtime (hours)=End Time−Start TimeSum It Up: Total the downtime durations over a shift, day, week, or month.
Automated Method (Using CMMS Software like Fogwing CMMS)
Real-Time Tracking: Automatically logs start and end times when a machine stops.
Auto-Calculation: Calculates total downtime per asset or location.
Reports & Dashboards: Visualizes downtime trends (daily/weekly/monthly).
Threshold Alerts: Triggers maintenance tasks if downtime exceeds limits.
Fogwing CMMS is a powerful tool for this. It's widely used across the US, UK, Europe, Middle East, Australia, and India for tracking and reducing downtime with real-time insights and automation.
Metrics to Monitor
Total Downtime Hours
Mean Time Between Failures (MTBF)
Mean Time To Repair (MTTR)
Downtime % = (Downtime / Total Time) × 100