- Mark as New
- Bookmark
- Subscribe
- Mute
- Subscribe to RSS Feed
- Permalink
- Report Inappropriate Content
04-12-2021 05:33 PM
Hi All
I am having trouble generating a report in table format that shows months across the columns, locations down the rows with a count of Incident & Service Request tickets. eg
Incident and Service Requests by Site by Month
| Site | Jan | Feb | Mar | Apr | May |
| Site 1 | 45 | 45 | 4 | 5 | 6 |
| Site 2 | 5 | 5 | 55 | 5 | 5 |
| Site 3 | 5 | 5 | 5 | 7 | 6 |
| Site 4 | 5 | 5 | 6 | 7 | 8 |
Solved! Go to Solution.
- Mark as New
- Bookmark
- Subscribe
- Mute
- Subscribe to RSS Feed
- Permalink
- Report Inappropriate Content
04-12-2021 07:35 PM
Hi!
In order to get both requests and incidents, you'd have to report on the task table and filter to only include those two task types.
As for months, you have to use one of the "time series" report widgets. They are the ones which can show data grouped by dates and aggregated on month. Unfortunately a pivot table is not in the group of time series widgets. You could use bar chart that trends on "opened at" by month, and then stack the columns by location. It would be the information that you are looking for, but in a different format.
Or you could use a calculated field. If you are on the Quebec release there is a button on the configure tab which lets you create such a field. You could then use a substring function to create a field that only contains the month number from the "created" field:

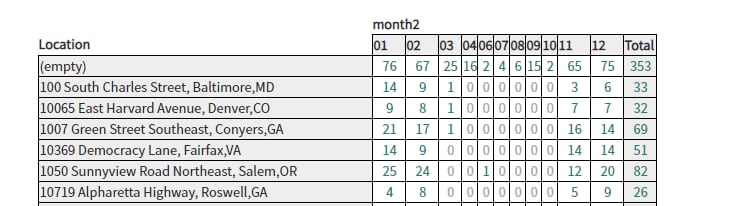
The result would be that you can use this field as columns:

If you wanted the actual month names, you'd have to add a field containing the name to the table, and a solution for populating that field. For example a business rule.
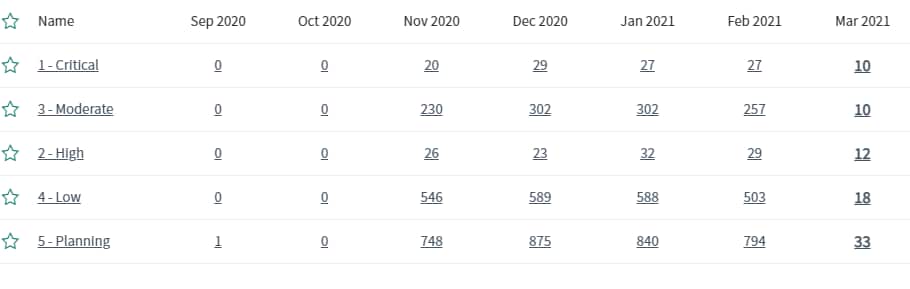
If you have performance analytics though, you'd have much nicer looking report by using scorecards and a breakdown on location. It would look something like this, only with locations instead of priorities. No new fields or other changes to the table would be required:

- Mark as New
- Bookmark
- Subscribe
- Mute
- Subscribe to RSS Feed
- Permalink
- Report Inappropriate Content
04-12-2021 07:35 PM
Hi!
In order to get both requests and incidents, you'd have to report on the task table and filter to only include those two task types.
As for months, you have to use one of the "time series" report widgets. They are the ones which can show data grouped by dates and aggregated on month. Unfortunately a pivot table is not in the group of time series widgets. You could use bar chart that trends on "opened at" by month, and then stack the columns by location. It would be the information that you are looking for, but in a different format.
Or you could use a calculated field. If you are on the Quebec release there is a button on the configure tab which lets you create such a field. You could then use a substring function to create a field that only contains the month number from the "created" field:
The result would be that you can use this field as columns:
If you wanted the actual month names, you'd have to add a field containing the name to the table, and a solution for populating that field. For example a business rule.
If you have performance analytics though, you'd have much nicer looking report by using scorecards and a breakdown on location. It would look something like this, only with locations instead of priorities. No new fields or other changes to the table would be required:
- Mark as New
- Bookmark
- Subscribe
- Mute
- Subscribe to RSS Feed
- Permalink
- Report Inappropriate Content
04-12-2021 11:06 PM
Thankyou, that looks good, will look into that further