Using time series reports in ServiceNow - How do I show a percentage on the y-axis in relation to the main data in the table. (i.e. SLA Has Breached where false = achieved & true = breached and we want to know the % of achieved by SLA Definition).
Options
- Mark as New
- Bookmark
- Subscribe
- Mute
- Subscribe to RSS Feed
- Permalink
- Report Inappropriate Content
10-29-2018 01:17 PM
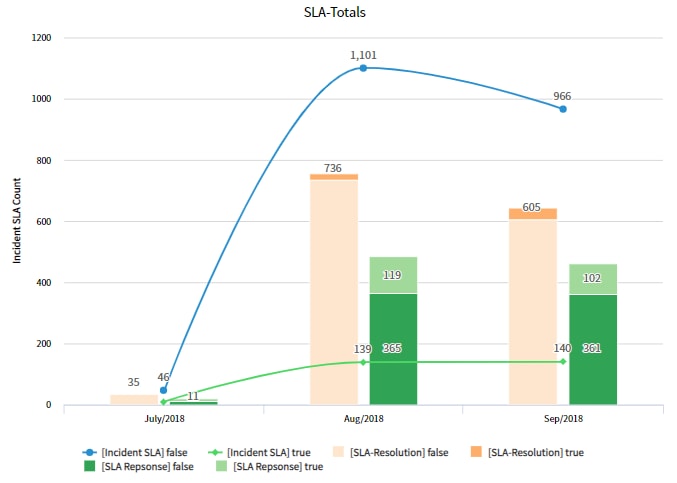
Using time series reports in ServiceNow - How do I show a percentage on the y-axis in relation to the data in the chart (i.e. SLA Has Breached where false = achieved & true = breached and we want to know the % of achieved by SLA Definition)? Ideally, we want to run the percentages against the right side of the chart that explains the two datasets used in the chart.

Labels:
- Labels:
-
Reporting
1 REPLY 1
Options
- Mark as New
- Bookmark
- Subscribe
- Mute
- Subscribe to RSS Feed
- Permalink
- Report Inappropriate Content
10-31-2018 01:24 PM
for any kind of calculation, like percentage, you'd need to use performance analytics and create a formula indicator to calculate the percentage.