- Mark as New
- Bookmark
- Subscribe
- Mute
- Subscribe to RSS Feed
- Permalink
- Report Inappropriate Content
11-23-2016 02:35 AM
Hi Community,
I have a question relating to the service status widget in an OOB service portal.
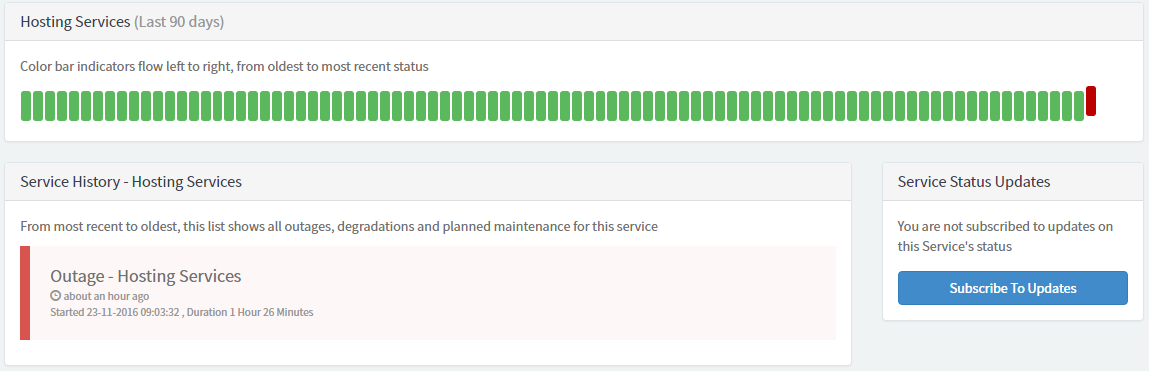
Currently when we register an outage, it shows correctly in the "Current Outage" section on the portal homepage, and clicking on system status also shows the current outage information.
What I have noticed is that whilst an outage is on-going, clicking the affected business service does not show a red mark for the current day in the widget on the system status page (Business Service - Last 90 days), it will only go red once the outage has finished.
1.

2.

I understand that the default functionality is to show historical outages on this particular widget, hence why this widget only shows a red mark once the outage is finished. But is there a way for this widget to show a red mark whilst the outage is on-going?
Everything is OOB at the moment so I haven't changed any coding yet, so any ideas here would be appreciated.
Thanks!
Solved! Go to Solution.
- Mark as New
- Bookmark
- Subscribe
- Mute
- Subscribe to RSS Feed
- Permalink
- Report Inappropriate Content
11-23-2016 07:26 AM
- Mark as New
- Bookmark
- Subscribe
- Mute
- Subscribe to RSS Feed
- Permalink
- Report Inappropriate Content
11-23-2016 04:54 AM
Hi Alex
You will need to modify the "Service Status" widget
here is the code which gets the last 90 days
for (var i = 89; i >= 0; i--) {
   var day = {};
   day.date = new GlideDateTime(gs.daysAgo(i)).getLocalDate().getDisplayValue();
   var out = new GlideAggregate("cmdb_ci_outage");
   out.addQuery("cmdb_ci", service.getUniqueValue());
   out.addQuery("end", ">=", gs.daysAgoStart(i));
   out.addQuery("begin", "<=", gs.daysAgoEnd(i));
   out.addAggregate('COUNT', 'type');
   out.query();
   day.count = 0;
When you are on day 0 (today) you must query for outages which have not ended yet
for (var i = 89; i >= 0; i--) {
   var day = {};
   day.date = new GlideDateTime(gs.daysAgo(i)).getLocalDate().getDisplayValue();
   var out = new GlideAggregate("cmdb_ci_outage");
   out.addQuery("cmdb_ci", service.getUniqueValue());
   if (i > 1)
         out.addQuery("end", ">=", gs.daysAgoStart(i));
   else
         out.addQuery("end", ">=", gs.nowNoTZ()).addOrCondition("end", "=", "NULL");
   out.addQuery("begin", "<=", gs.daysAgoEnd(i));
   out.addAggregate('COUNT', 'type');
   out.query();
   day.count = 0;
The above code has not been tested
- Mark as New
- Bookmark
- Subscribe
- Mute
- Subscribe to RSS Feed
- Permalink
- Report Inappropriate Content
11-23-2016 05:37 AM
Hi Lars,
Thanks very much for your reply, It certainly moves this in the right direction.
The active outage now shows a red mark in the service status widget for the current day. The issue now is that when I end the outage the widget switches back to showing a green mark for the current day. Do you know why this might be the case?
The code is exactly as you have outlined above.
Thanks for the help!
- Mark as New
- Bookmark
- Subscribe
- Mute
- Subscribe to RSS Feed
- Permalink
- Report Inappropriate Content
11-23-2016 05:47 AM
Ahh you probably need this instead in line 7
out.addQuery("end", ">=", gs.daysAgoStart(i).addOrCondition("end", "=", "NULL");
Otherwise it doesn't find it when you end it
- Mark as New
- Bookmark
- Subscribe
- Mute
- Subscribe to RSS Feed
- Permalink
- Report Inappropriate Content
11-23-2016 06:49 AM
I have tried adding that in as you described but I get the same result unfortunately.
The code now reads:
for (var i = 89; i >= 0; i--) {
var day = {};
day.date = new GlideDateTime(gs.daysAgo(i)).getLocalDate().getDisplayValue();
var out = new GlideAggregate("cmdb_ci_outage");
out.addQuery("cmdb_ci", service.getUniqueValue());
if (i >= 1)
out.addQuery("end", ">=", gs.daysAgoStart(i)).addOrCondition("end", "=", "NULL");
else
out.addQuery("end", ">=", gs.nowNoTZ()).addOrCondition("end", "=", "NULL");
out.addQuery("begin", "<=", gs.daysAgoEnd(i));
out.addAggregate('COUNT', 'type');
out.query();
day.count = 0;
Thanks!