How to Group Catalog Tasks by Labels in a Bar Chart Report?
- Mark as New
- Bookmark
- Subscribe
- Mute
- Subscribe to RSS Feed
- Permalink
- Report Inappropriate Content
09-02-2025 09:30 AM
Hi all,
I’m working with a fulfiller group that uses labels (tags) to categorize their work in ServiceNow. They’ve shared a sample report, and I’m trying to replicate it in a more dynamic format. For this post, I’m focusing on the “Auto” department.
I can easily filter for “Auto” tasks because their department contains the word "auto" — so identifying the department is straightforward.
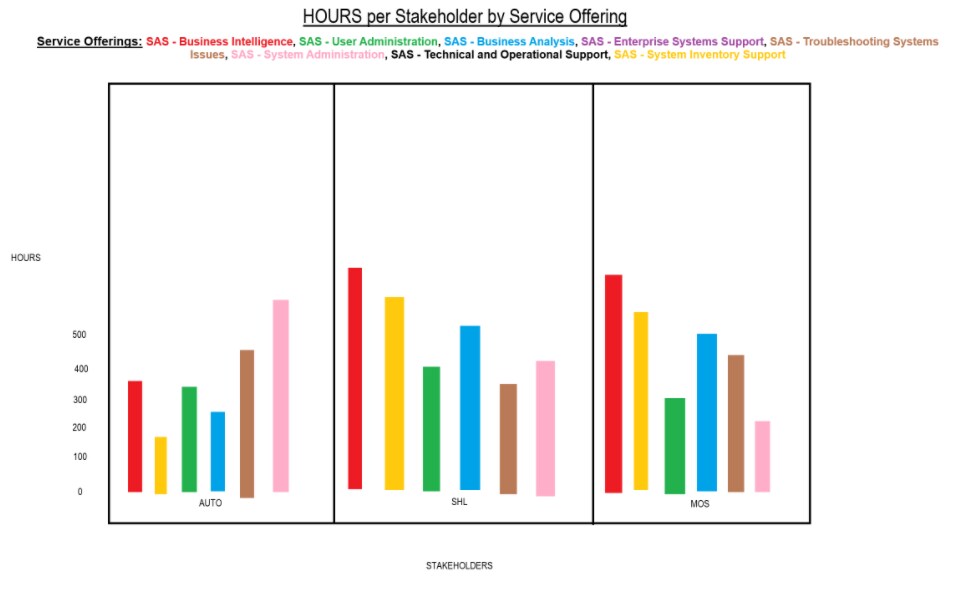
What I’m trying to build is a bar chart that:
- Groups by department
- Stacks by labels
The goal is to show how much time is spent per department, broken down by the labels they use.
Data Context:
- Time is entered via the task_time_worked table.
- Labels are applied to sc_task records.
Questions:
- Is it possible to build a bar chart that groups by department and stacks by label?
- If not, is there another visualization or reporting method that could show:
- Time spent per department
- Time spent per label
The team wants to understand how their time is distributed across departments and across the types of work they tag. I’m open to alternative approaches if a bar chart isn’t the best fit.
Thanks in advance for any ideas or suggestions.
- Mark as New
- Bookmark
- Subscribe
- Mute
- Subscribe to RSS Feed
- Permalink
- Report Inappropriate Content
09-02-2025 12:36 PM
Hi @Andrew Meza ,
Yes, you can create a bar chart in ServiceNow that groups by department and stacks by label to visualize time spent per department and per label....
Create a New Report:
Navigate to Reports > Create New and then Select Bar Chart as the report type....
Define the Data Source:
Set the Table to sc_task to report on catalog tasks.
Ensure that the sc_task records are linked to the appropriate department and have labels applied.
>> Configure Grouping:

Under the Group by section, select Department to group the tasks by department.

>> Configure Stacking:

Under the Stack by section, select Label to stack the bars by the labels applied to the tasks.

>> Add Time Tracking Data:

To visualize time spent, you can use the task_time_worked table.

Create a Calculated Field to sum the time entries from task_time_worked associated with each sc_task.

>> Apply Filters:

Set filters to include only the relevant records, such as tasks from the Auto department.

>> Customize Visualization:

Adjust the chart settings to display the data in a clear and meaningful way, such as showing totals or averages.
If you found my response helpful, please mark it as ‘Accept as Solution’ and ‘Helpful’. This helps other community members find the right answer more easily and supports the community...
Kaushal Kumar Jha - ServiceNow Technical Consultant/Developer
- Mark as New
- Bookmark
- Subscribe
- Mute
- Subscribe to RSS Feed
- Permalink
- Report Inappropriate Content
09-03-2025 07:54 AM
When II try to use the stacked functionality "tags" isn't not an option.
