Performance Analytics: Adding Thresholds/Milestones to A Dial Visualization
Options
- Mark as New
- Bookmark
- Subscribe
- Mute
- Subscribe to RSS Feed
- Permalink
- Report Inappropriate Content
02-28-2025 01:19 PM - edited 02-28-2025 01:21 PM
Hello,
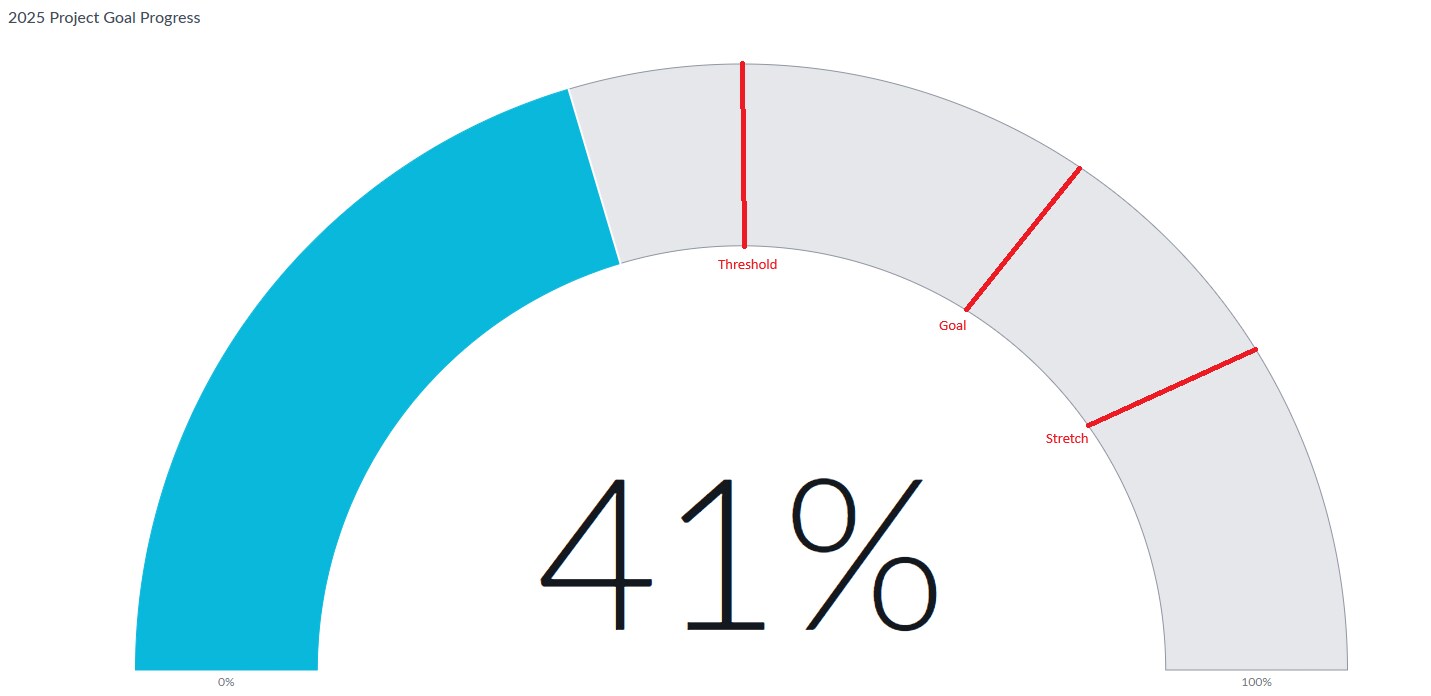
I have created a dial visualization (picture attached). It shows the progress of our project goal for the year of 2025, right now reflecting at 41% complete.
Is there a way to input thresholds or milestones within this dial visualization? Our organization's midpoint (threshold) is 50%, our goal is 62%, and our stretch is 74%, so i'd like a way to show that. (i drew in red on the picture attached to this question for reference).
OR should a different visual be used for goal tracking?
Many thanks!
#performanceanalytics #xanadu
0 REPLIES 0