- Mark as New
- Bookmark
- Subscribe
- Mute
- Subscribe to RSS Feed
- Permalink
- Report Inappropriate Content
03-23-2020 01:55 AM
Hi,
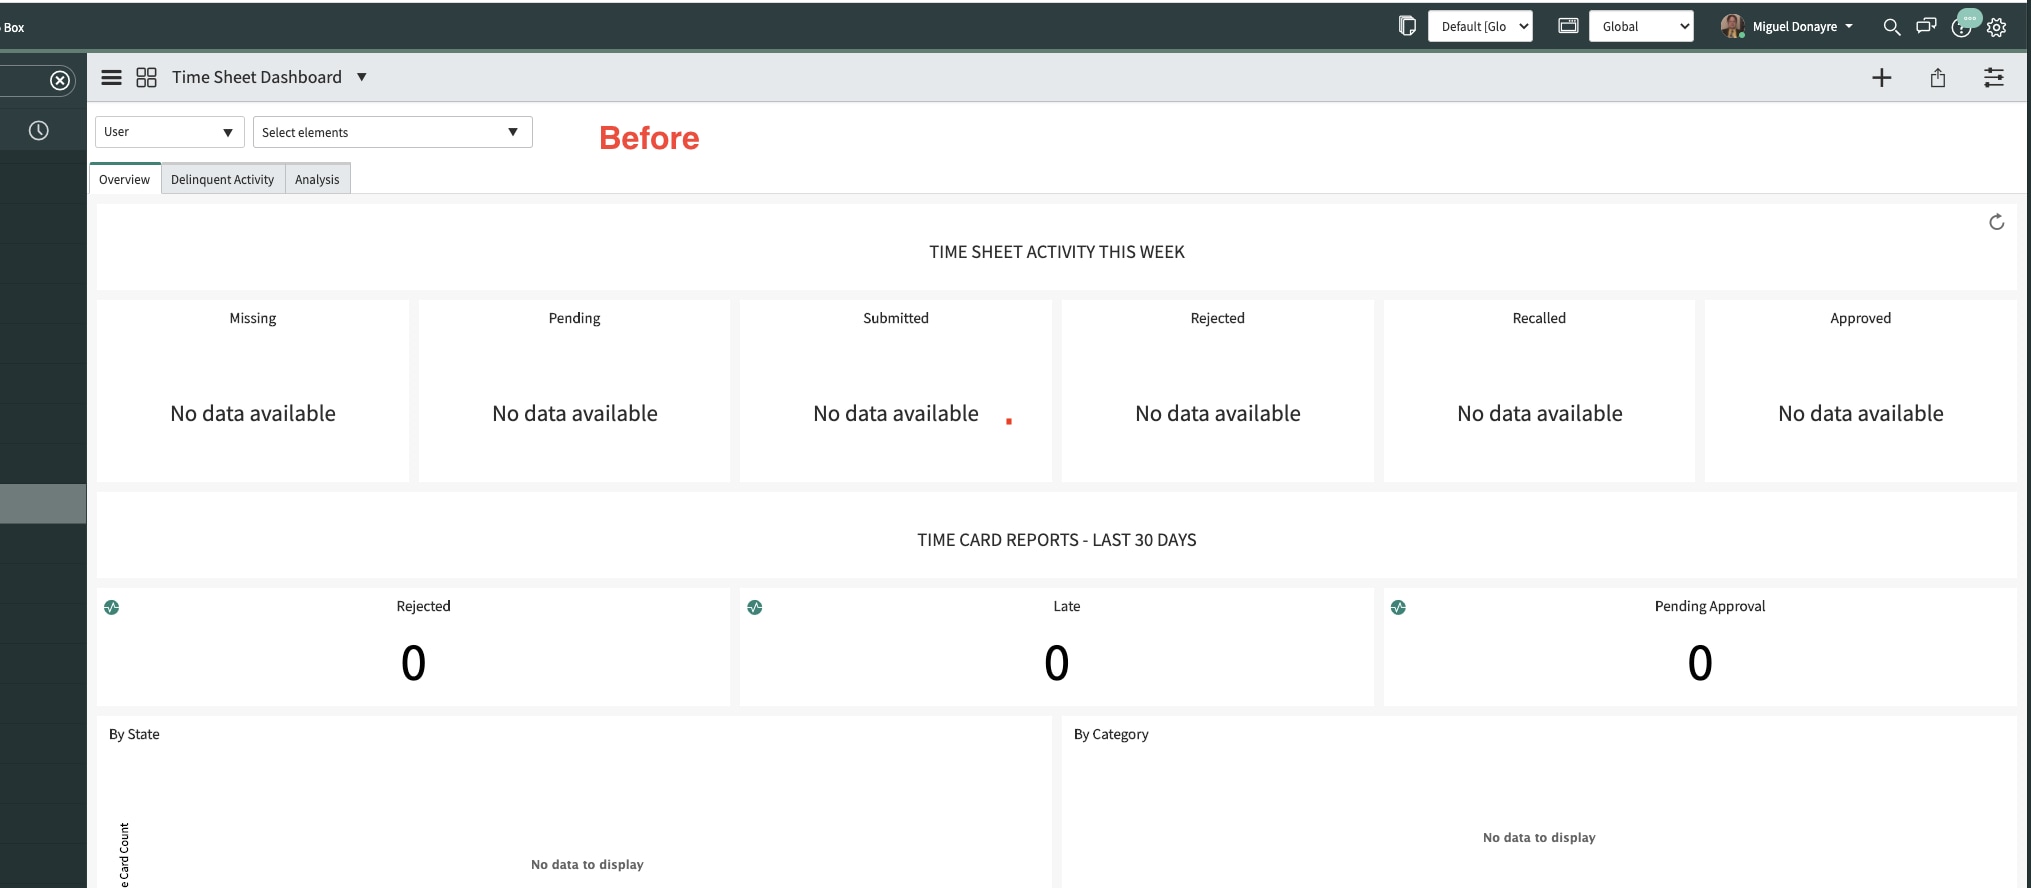
we are planning to use the Time Sheet Dashboard, as a simple OOTB way to manage Timecards. However, upon opening it, most of the indicators on both Overview and Delinquent Activity show 'no data available' (despite there obviously being a lots of data). This error seems to be present also on OOTB Testing instances.
Is there an easy fix, or does it require deeper knowledge of Performance Analytics to fix?
Thanks in advance.

Solved! Go to Solution.
- Labels:
-
Time Card Management
- Mark as New
- Bookmark
- Subscribe
- Mute
- Subscribe to RSS Feed
- Permalink
- Report Inappropriate Content
08-18-2020 07:36 PM
Hello,
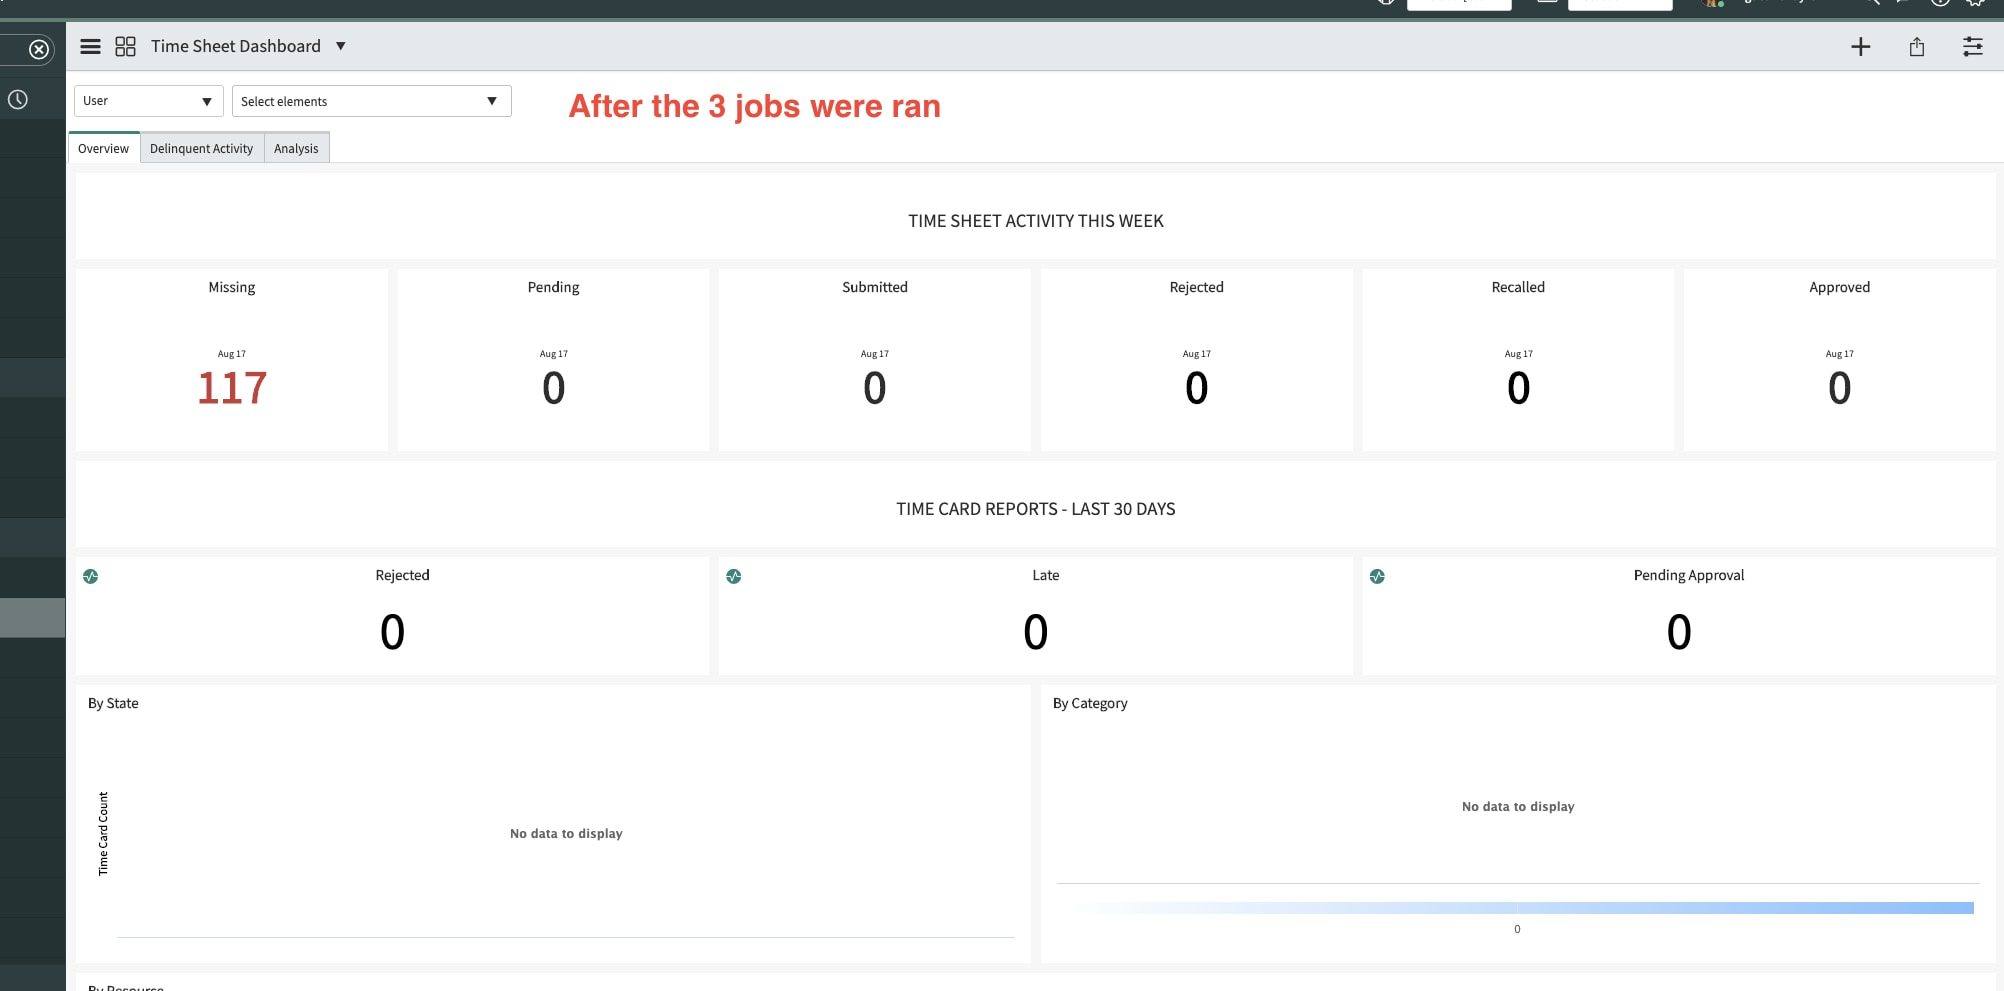
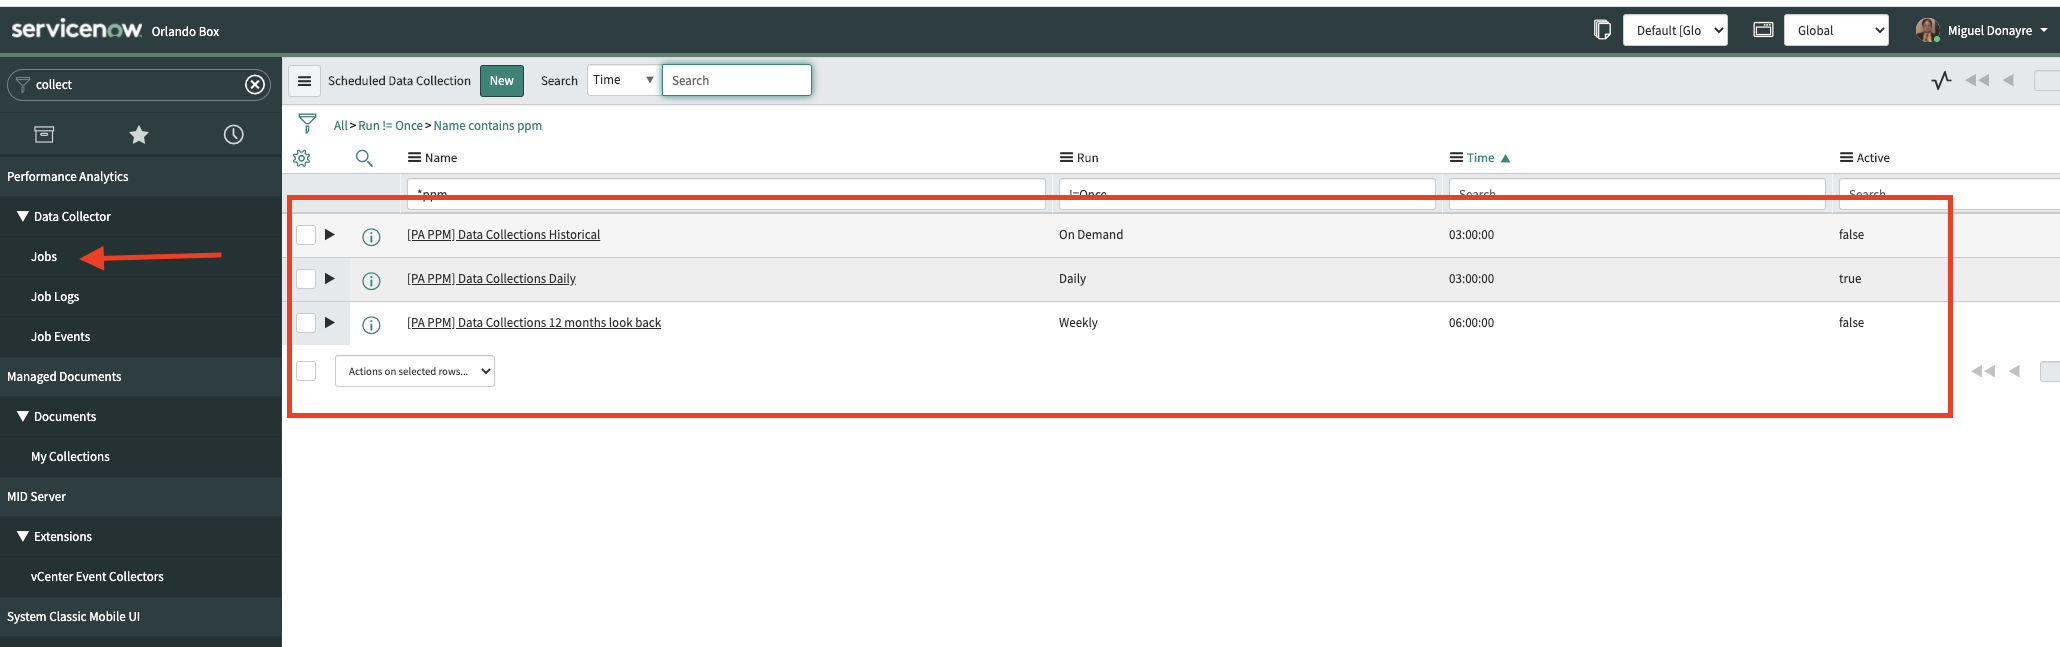
OOTB there are 3 Scheduled Data Collection jobs that populate the Timesheet dashboard. The 1st one and most import is "[PA PPM] Data Collections Daily" this collects and populates the daily graphs on the dashboard, is not active OOTB. Mark it active and you can hit the "Execute Now" button and you should see the graph now populated after the job runs. There are also two other jobs that should be run as well. Scheduled Data Collection called - "Scheduled Data Collection" which is also inactive and is only ran on demand(you can change it to scheduled if you want) click on the "Execute Now" button and it will populate any missing data that the 1st job didn't catch. The Last one is the ["PA PPM] Data Collections 12 months look back " follow the same step as the 1st one.


- Mark as New
- Bookmark
- Subscribe
- Mute
- Subscribe to RSS Feed
- Permalink
- Report Inappropriate Content
08-18-2020 04:52 PM
Those widgets are showing No data available because you need Performance Analytics to run those data points. Confirm you have PA installed, set up and licensed.
Please mark reply as helpful or correct if applicable. Thanks! - Rae Ann
- Mark as New
- Bookmark
- Subscribe
- Mute
- Subscribe to RSS Feed
- Permalink
- Report Inappropriate Content
08-23-2020 11:41 PM
Yes, you're correct - after activatiing and running the jobs for indicators, the dashboard worked correctl.y
PA is available by default with PPM License.
- Mark as New
- Bookmark
- Subscribe
- Mute
- Subscribe to RSS Feed
- Permalink
- Report Inappropriate Content
08-18-2020 07:36 PM
Hello,
OOTB there are 3 Scheduled Data Collection jobs that populate the Timesheet dashboard. The 1st one and most import is "[PA PPM] Data Collections Daily" this collects and populates the daily graphs on the dashboard, is not active OOTB. Mark it active and you can hit the "Execute Now" button and you should see the graph now populated after the job runs. There are also two other jobs that should be run as well. Scheduled Data Collection called - "Scheduled Data Collection" which is also inactive and is only ran on demand(you can change it to scheduled if you want) click on the "Execute Now" button and it will populate any missing data that the 1st job didn't catch. The Last one is the ["PA PPM] Data Collections 12 months look back " follow the same step as the 1st one.