- 新着としてマーク
- ブックマーク
- 購読
- ミュート
- RSS フィードを購読する
- ハイライト
- 印刷
- 不適切なコンテンツを報告
06-13-2022 01:58 AM
Client Scripts からJavascriptを入力して処理を行おうと考えているのですが、
方法が見つからず困っております。
デバッグ、出力ログを確認する機能があるかわかりますでしょうか?
調べたところ、Romaまでは「Field watcher」という機能があったようですが、
San DiegoからはUIが変わっていて、「Field watcher」機能を出すことが出来ないです。
参考URL
https://docs.servicenow.com/en-US/bundle/sandiego-application-development/page/script/debugging/concept/c_JavaScriptDebugWindow.html
San Diegoにて、Client Scriptのデバッグ/ログの確認が出来る方法がありましたら、
教えて頂けますと幸いです。
宜しくお願い致します。
解決済! 解決策の投稿を見る。
- 新着としてマーク
- ブックマーク
- 購読
- ミュート
- RSS フィードを購読する
- ハイライト
- 印刷
- 不適切なコンテンツを報告
06-13-2022 03:29 AM
申し訳ありませんが、日本語は話せません。私があなたの質問を理解するならば、以下が役立つかもしれません。
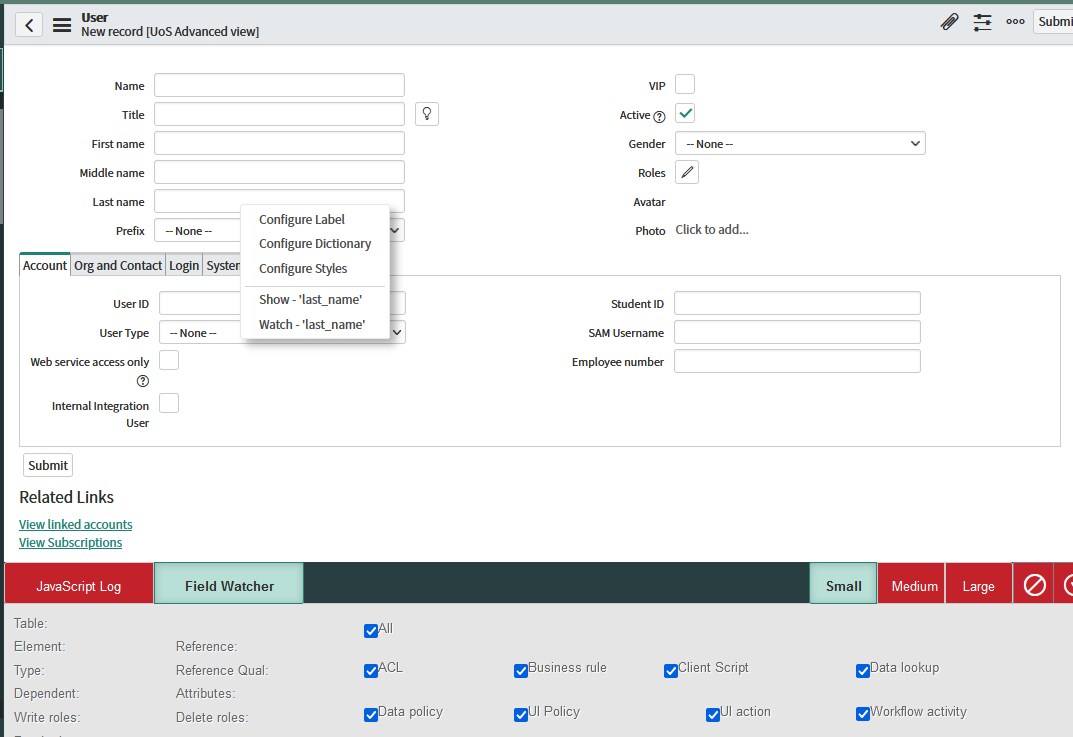
1.プロファイルでJavascriptログとフィールドウォッチャーをオンにします
https://docs.servicenow.com/en-US/bundle/sandiego-application-development/page/script/debugging/concept/c_JavaScriptDebugWindow.html
2.デバッグをオンにします
https://docs.servicenow.com/bundle/sandiego-application-development/page/script/debugging/concept/c_SessionDebug.html
hth,matt

- 新着としてマーク
- ブックマーク
- 購読
- ミュート
- RSS フィードを購読する
- ハイライト
- 印刷
- 不適切なコンテンツを報告
06-13-2022 08:09 AM
Hiya,
Sadly (?) we are still on Rome.
I suspect the following may be of assistance to you:
https://community.servicenow.com/community?id=community_question&sys_id=2588fae91b268150c790ece6b04bcb02
Not sure how relevant for you, but there is also:
https://community.servicenow.com/community?id=community_question&sys_id=a17d961c1bbe855086b3ece6b04bcb69
https://community.servicenow.com/community?id=community_question&sys_id=eec267641b16051498a1ece6b04bcb50
Hope that helps,Matt
