Need help understanding the response time values.
- Mark as New
- Bookmark
- Subscribe
- Mute
- Subscribe to RSS Feed
- Permalink
- Report Inappropriate Content
04-26-2018 03:44 PM
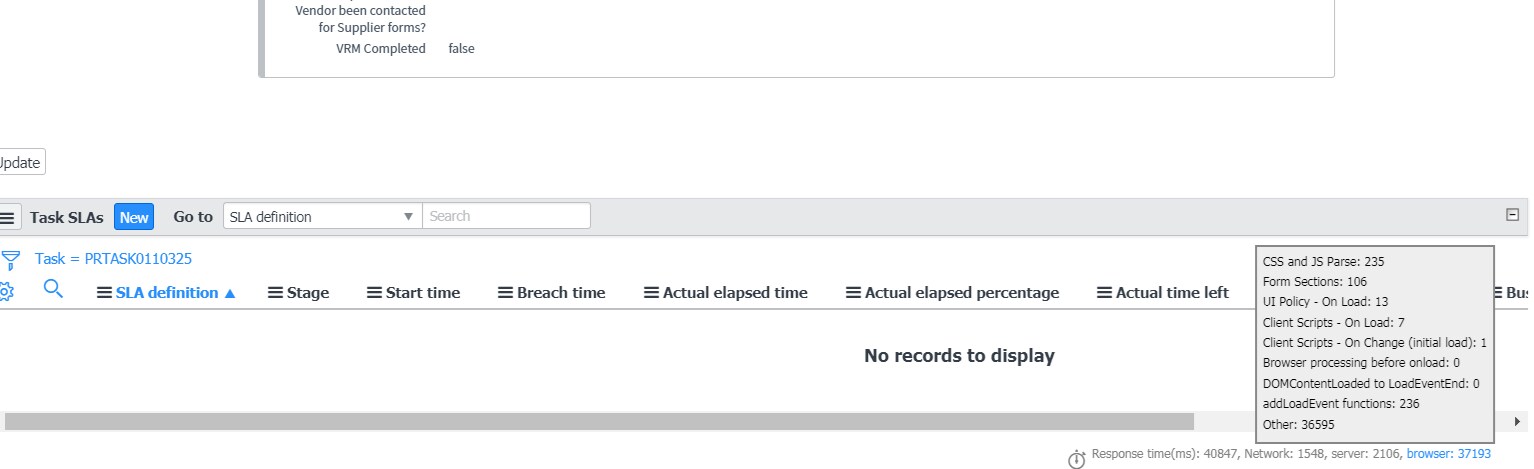
I have a custom page which has a load time of 40sec and most of the time is taken by the browser(37s). When the browser link is expanded, the client scripts/ UI policies take up very little time and the "Other" takes up 36s which is a major chunk. Is there anyway I can get into whats happening behind the scenes for the "other" option so that i can improve the page load time?
- Labels:
-
Customer Service Management
- Mark as New
- Bookmark
- Subscribe
- Mute
- Subscribe to RSS Feed
- Permalink
- Report Inappropriate Content
04-27-2018 06:11 AM
Do you have the Client Transaction Timings plugin enabled? It should give you more granularity on what's happening on the client side.
- Mark as New
- Bookmark
- Subscribe
- Mute
- Subscribe to RSS Feed
- Permalink
- Report Inappropriate Content
04-27-2018 09:31 AM
Hi Brad,
Yes i have. and i got the client transaction log in which the client response time is 40s, i can see the max time took is by the browser is 37s there as well. The in detail log also shows that the client scripts and the UI policies are taking much less time comparatively.
I want to understand what exactly does browser time mean, so that I can dig in to that area and fix issues if any.

- Mark as New
- Bookmark
- Subscribe
- Mute
- Subscribe to RSS Feed
- Permalink
- Report Inappropriate Content
04-27-2018 01:59 PM
Hmm, I don't know that you can go much more granular from there. Do you have a large number of fields or lots of related lists loading? That seems like a really long time for a form to load.
- Mark as New
- Bookmark
- Subscribe
- Mute
- Subscribe to RSS Feed
- Permalink
- Report Inappropriate Content
05-01-2018 11:29 AM
Thanks Brad! We do have a few related list which are loading on default.
This is an intermittent issue so will have to dig in more. Will update if I find