


sabell2012

Mega Sage
Options
- Subscribe to RSS Feed
- Mark as New
- Mark as Read
- Bookmark
- Subscribe
- Printer Friendly Page
- Report Inappropriate Content
03-29-2017
07:31 AM
NOTE: MY POSTINGS REFLECT MY OWN VIEWS AND DO NOT NECESSARILY REPRESENT THE VIEWS OF MY EMPLOYER, ACCENTURE.
DIFFICULTY LEVEL: INTERMEDIATE
Assumes having taken the class SSNF and has good intermediate level of knowledge and/or familiarity with Scripting in ServiceNow.
I have been done a lot of work with Scoped Applications, and found myself, once-again, wishing for in the System Log, a display of the record create time with milliseconds! The current display has always been in seconds and has always been inadequate for determining what was run and when. Since the platform is so fast for most of what it does (a good thing) it has a tendency to log things down quick as well. So, debug code, etc. will often be displayed all at once within the same second (a BAD thing); which means that the log messages will often arrange themselves out of order (the reason it is a BAD thing). I have connived, I have whined, I have blustered, I have tried various methods (crying and groveling didn't work either). To get it included, but to no avail!
So not being one to sit still very long on a problem (it has been since the beginning 2012 that I started making noises about this), I decided to do something about it! For the longest time I utilized a method I have written about before: Community Code Snippets - System Log Ordering Problem Workaround. That worked fine, but wasn't so great if I had to log call-outs, and the method I was calling contained logging as well. I would, likely, still have an ordering issue!
After noodling on it; I came up with a reasonable way of logging milliseconds in my log messages. This new method allows me to see when things are really happening, and also gave me the ability to order my messages correctly.
Let's take my original example from my Log Ordering article (and do terrible things to it)!
Original (not allowed in a Scoped app btw):
gs.info('---> 1. Hi there');
gs.info('---> 2. This is message 2!');
gs.info('---> 3. This is message 3!');
gs.info('---> 4. Hi there, again!');
Run this in Scripts - Background then check the System Log and search for "--->" in the message field. You should see something like this:
Nice. Not. Makes you want to cry in frustration, doesn't it? Ok, hang in there, help is on the way!
Now using gs.info and variable substitution (see: Community Code Snippets - Logging: Some Notes on Variable Substitution) change the gs.log statements to gs.info (which are Scope safe). Then add in a location variable (cool tip: you can use the "type" variable in a Script Include - this.type) and integrate that with our gs.info statements. Thusly:
var location = 'SB: Millisecond logging'; // SB = Scripts Background

gs.info('---> [{0}] 1. Hi there', [location]);
gs.info('---> [{0}] 2. This is message 2!', [location]);
gs.info('---> [{0}] 3. This is message 3!', [location]);
gs.info('---> [{0}] 4. Hi there, again!', [location]);
My results:
*** Script: ---> [BS: Millisecond logging] 1. Hi there
*** Script: ---> [BS: Millisecond logging] 2. This is message 2!
*** Script: ---> [BS: Millisecond logging] 3. This is message 3!
*** Script: ---> [BS: Millisecond logging] 4. Hi there, again!
Next let's add in the milliseconds indicator so that we have something to find and sort against:
var location = 'SB: Millisecond logging';

gs.info('---> [{0}-{1}] 1. Hi there', [new GlideDateTime().getNumericValue(), location]);
gs.info('---> [{0}-{1}] 2. This is message 2!', [new GlideDateTime().getNumericValue(), location]);
gs.info('---> [{0}-{1}] 3. This is message 3!', [new GlideDateTime().getNumericValue(), location]);
gs.info('---> [{0}-{1}] 4. Hi there, again!', [new GlideDateTime().getNumericValue(), location]);
Remember the gs.info statement get's finicky inside of a Scoped Application, and thus the reason for the object array inside of the gs.info parameters. It is best to get into the habit of just using the brackets anyway so that your code is always scope-safe.
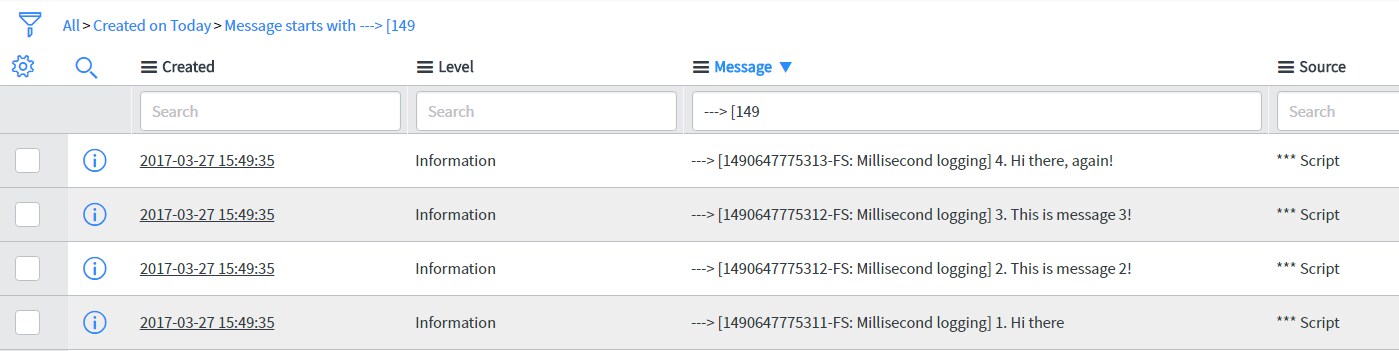
Okay, if we run this from Scripts - Background what does it look like? Ugly, but you can see the milliseconds in the message now. Note that the Created column is next to useless here. Also, Source is useless for debugging when migrating away from gs.log. My results just happened to sort right, but notice that I sorted on Created.
So let's add a filter for ---> [169 and sort by Message descending. Whoa! Magic! Now they are in order!
However, the code is ugly. We can clean this up a bit like this (notice any patterns dropping out of the code?):
var location = 'SB: Millisecond logging';

gs.info('---> [{0}-{1}]\n1. Hi there',
    [new GlideDateTime().getNumericValue(), location]);
gs.info('---> [{0}-{1}]\n2. This is message 2!',
    [new GlideDateTime().getNumericValue(), location]);
gs.info('---> [{0}-{1}]\n3. This is message 3!',
    [new GlideDateTime().getNumericValue(), location]);
gs.info('---> [{0}-{1}]\n4. Hi there, again!',
    [new GlideDateTime().getNumericValue(), location]);
Which will give us this:
Better, but still the code looks a little cluttered. Also, we have a pattern! That means at the very minimum: function! Since the parameters are listed as an array we can use a combination of message, parameter values, and location and feed those into a function which will then handle the rest. Something like this:
var location = 'SB: Millisecond logging';

logInfo('1. Hi there: {0}', location, ['Steve']);
logInfo('2. This is message 2!', location);
logInfo('3. This is message 3!', location);
logInfo('4. Hi there, again {0}', location, ['Steve']);

function logInfo(message, location, parms) {
    message = '---> [' + new GlideDateTime().getNumericValue() + '-' + location + ']\n' + message;
    gs.info(message, parms);
}
And that would give you exactly the same thing as earlier, but the log code is much cleaner (i.e. easier to maintain).
Obviously, you can do all sorts of things to rearrange the function how you please. My purpose was to give you an idea of how to do this sort of thing. You could always put the function into a Script Include (and it is scope safe) as part of a function library. You could also rig this up to handle errors and warnings as well.
Regardless of how you go about it you can see the value of having milliseconds in the log. Maybe someday we will get this as part of the Created and Updated columns...maybe. Until then this your best bet. 🙂
Enjoy!
Steven Bell.
If you find this article helps you, don't forget to log in and mark it as "Helpful"!
Originally published on: 03-29-2017 09:31 AM
I updated the code and brought the article into alignment with my new formatting standard.
- 8,162 Views
4 Comments
You must be a registered user to add a comment. If you've already registered, sign in. Otherwise, register and sign in.
