How to set up timeline visualisations
- Mark as New
- Bookmark
- Subscribe
- Mute
- Subscribe to RSS Feed
- Permalink
- Report Inappropriate Content
08-05-2017 12:02 AM
Hi everyone,
Please can some one help me and show me how to set up time line visualisations on my test service now instance. I have been through the documentation and cannot make this work. All I am looking to do is set up a visualisation which shows the various categories for the changes as the lanes and then the start dates as the panels with the short decription as the title bars. This seems easy?
Here is my raw data

Here is my timeline visualtion criteria

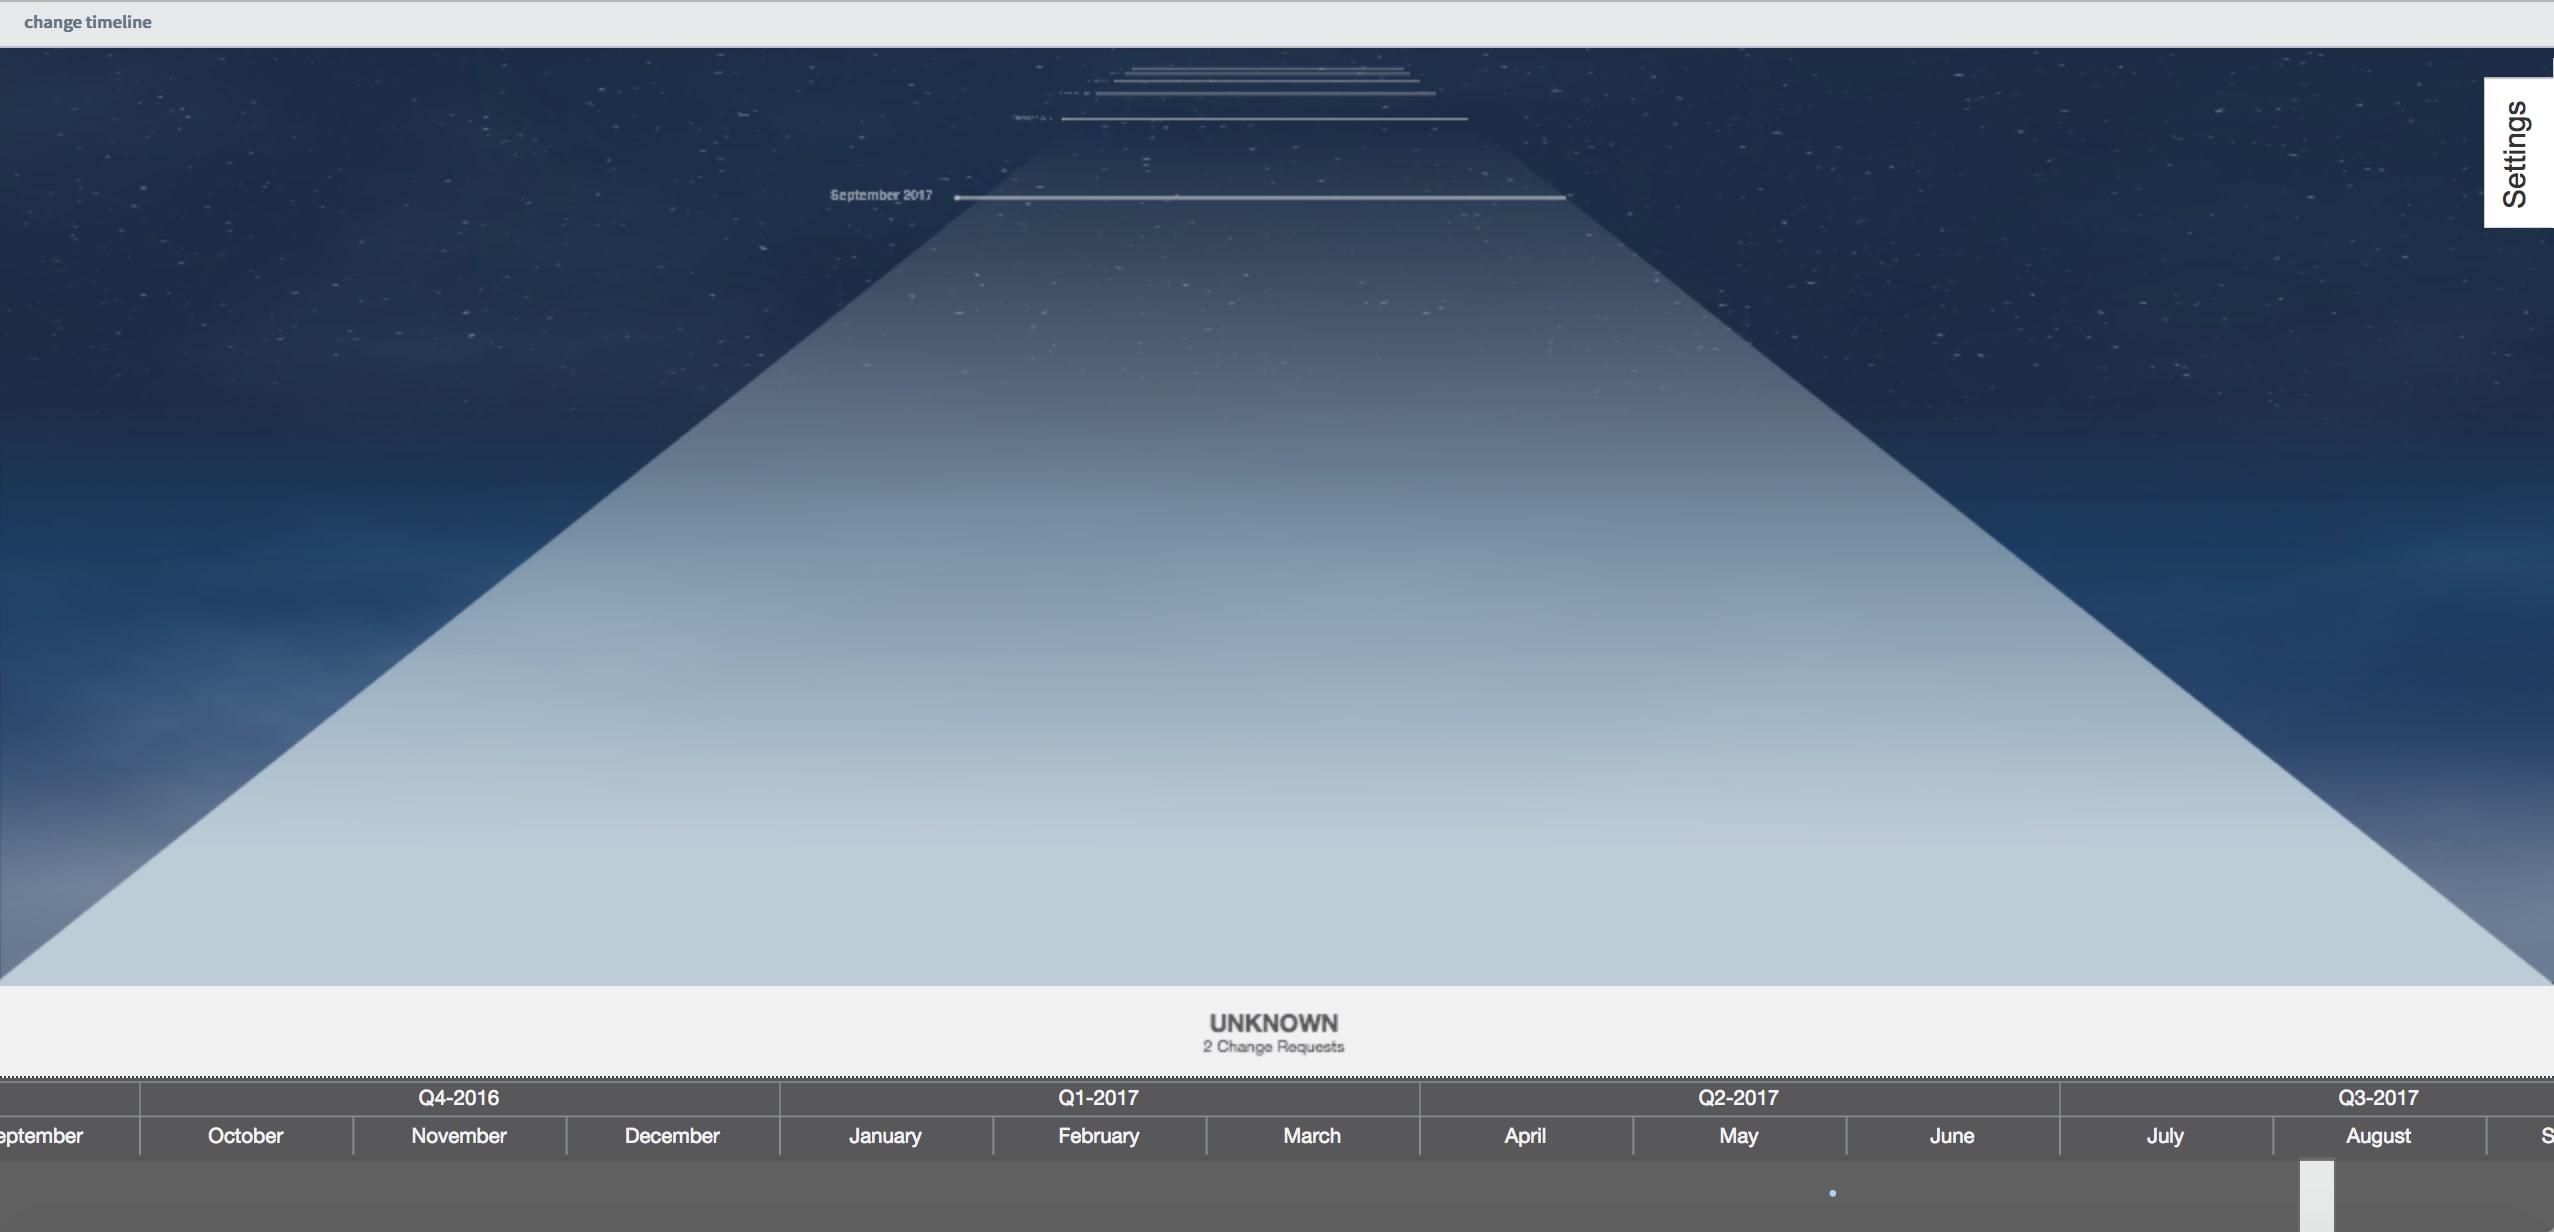
When I go back to open changes and click timeline visualisation, this is what I see :

You can see I am looking at this month and no changes are listed and the lanes are not showing the category just unknown.
This is what it shows under filtering conditions:

I don't understand where it is picking up the activity due state on the filter conditions :

I read on one article you needed another Form view Selection so here is this criteria:


I have really tried to sort this out but it is just not playing ball. Please can someone show me the error of my ways.
Thanks
Andrew
- Mark as New
- Bookmark
- Subscribe
- Mute
- Subscribe to RSS Feed
- Permalink
- Report Inappropriate Content
08-05-2017 01:54 PM
Hi Andrew,
Do you see the same result if you click View on the Change Timeline form?
Agreed - it is not obvious why Activity Due should be even referenced.
- Mark as New
- Bookmark
- Subscribe
- Mute
- Subscribe to RSS Feed
- Permalink
- Report Inappropriate Content
08-05-2017 02:55 PM
Hi,
I'm not quite sure which view you mean?
Thanks
Andrew
- Mark as New
- Bookmark
- Subscribe
- Mute
- Subscribe to RSS Feed
- Permalink
- Report Inappropriate Content
08-05-2017 05:59 PM
I meant this View (button)..

It might be appropriate to raise an incident for Technical Support via HI so they could investigate the mysterious appearance of Activity Dues.
Edit:
Assuming the instance you are on is an actual Customer instance - Not if it is a Developer instance for example.
Timeline visualization for change requests looks like this on my Istanbul instance

- Mark as New
- Bookmark
- Subscribe
- Mute
- Subscribe to RSS Feed
- Permalink
- Report Inappropriate Content
08-05-2017 02:22 PM
Hi Andrew,
This works in my development instance. Perhaps there is another timeline record against the change_request table. Did you try setting yours to be the "Default"?
Regards,
Mike