How to set y-axis scale on reports
Options
- Mark as New
- Bookmark
- Subscribe
- Mute
- Subscribe to RSS Feed
- Permalink
- Report Inappropriate Content
12-20-2016 12:46 AM
Hi All,
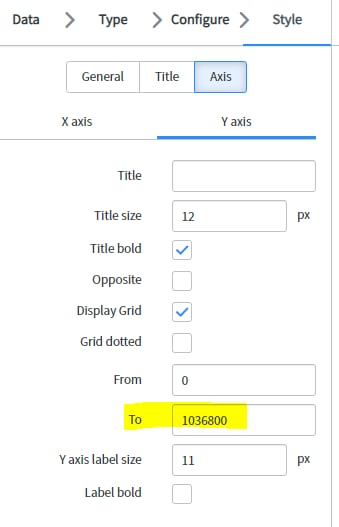
I have a bar chart with Aggregation on Duration , it displays the Y-Axis scale based on the higher average duration taken , See screenshot below .How to set this scale limit ?

Thanks In Advance
Labels:
- Labels:
-
Analytics and Reports
5 REPLIES 5
Options
- Mark as New
- Bookmark
- Subscribe
- Mute
- Subscribe to RSS Feed
- Permalink
- Report Inappropriate Content
04-12-2021 01:36 PM
