- Mark as New
- Bookmark
- Subscribe
- Mute
- Subscribe to RSS Feed
- Permalink
- Report Inappropriate Content
08-02-2016 12:38 AM
I have a record producer that have 58 variables (!!) where 8 variables are reference types, 7 are date types, 12 are select box types, 22 are single line text types, 3 are lookup select box types and a few other types. This record producer takes appx. 1 minute and 30 seconds to load which is not acceptable by the end user. Does anyone have suggestions/tips for improving the load time for this record producer (besides removing some of the variables) ?
Thanks.
Solved! Go to Solution.
- Mark as New
- Bookmark
- Subscribe
- Mute
- Subscribe to RSS Feed
- Permalink
- Report Inappropriate Content
08-02-2016 04:32 AM
This makes me very sad. The main reason for record producers is to give the user a great data input experience with real questions instead of field labels and few things to fill out instead of an entire large detailed form. Consider the OOB incident record producer - 4 questions.
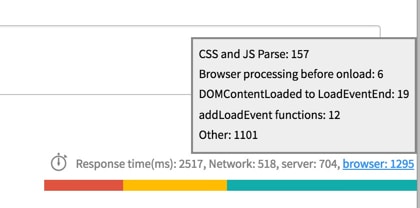
Anyway, use the response time indicator on the form to help diagnose where the time is coming from. It's that little clock that nobody ever seems to notice in the lower right corner. Click it once it provides some detail. Click the browser link and you get details about what is going on client side.

Response Time Indicator - ServiceNow Wiki
Troubleshooting Performance - ServiceNow Wiki
- Mark as New
- Bookmark
- Subscribe
- Mute
- Subscribe to RSS Feed
- Permalink
- Report Inappropriate Content
08-02-2016 12:48 AM
Can you revisit your onload scripts?
Does your scripts contain Gliderecord or sync Ajax calls? Can you convert them to async ones?
Instead of doing multiple ajax calls for different things, can you club them together and return multiple values?
- Mark as New
- Bookmark
- Subscribe
- Mute
- Subscribe to RSS Feed
- Permalink
- Report Inappropriate Content
08-02-2016 04:32 AM
This makes me very sad. The main reason for record producers is to give the user a great data input experience with real questions instead of field labels and few things to fill out instead of an entire large detailed form. Consider the OOB incident record producer - 4 questions.
Anyway, use the response time indicator on the form to help diagnose where the time is coming from. It's that little clock that nobody ever seems to notice in the lower right corner. Click it once it provides some detail. Click the browser link and you get details about what is going on client side.
Response Time Indicator - ServiceNow Wiki
Troubleshooting Performance - ServiceNow Wiki
- Mark as New
- Bookmark
- Subscribe
- Mute
- Subscribe to RSS Feed
- Permalink
- Report Inappropriate Content
08-03-2016 12:57 AM
Hi Chuck,
Thanks for your answer.
I investigated it further and on my production instance the server takes appx. 100 seconds (!!!) in response time while network and browser only takes 42 ms and 1473ms. Then I tried to use the same record producer on my test instance and that only takes about 3-4 seconds in response time. But how can I debug what's taking all this time on my production instance ?
I think I'll contact servicenow support in order to get their help. Thanks
/Kim
- Mark as New
- Bookmark
- Subscribe
- Mute
- Subscribe to RSS Feed
- Permalink
- Report Inappropriate Content
08-03-2016 03:44 AM
Thank you for the follow up Kim. Let me know what you hear from Support.