Platform Analytics - Dot-walk table columns on data visualizations stuck in infinite loop
- Mark as New
- Bookmark
- Subscribe
- Mute
- Subscribe to RSS Feed
- Permalink
- Report Inappropriate Content
7 hours ago
Hi everyone!
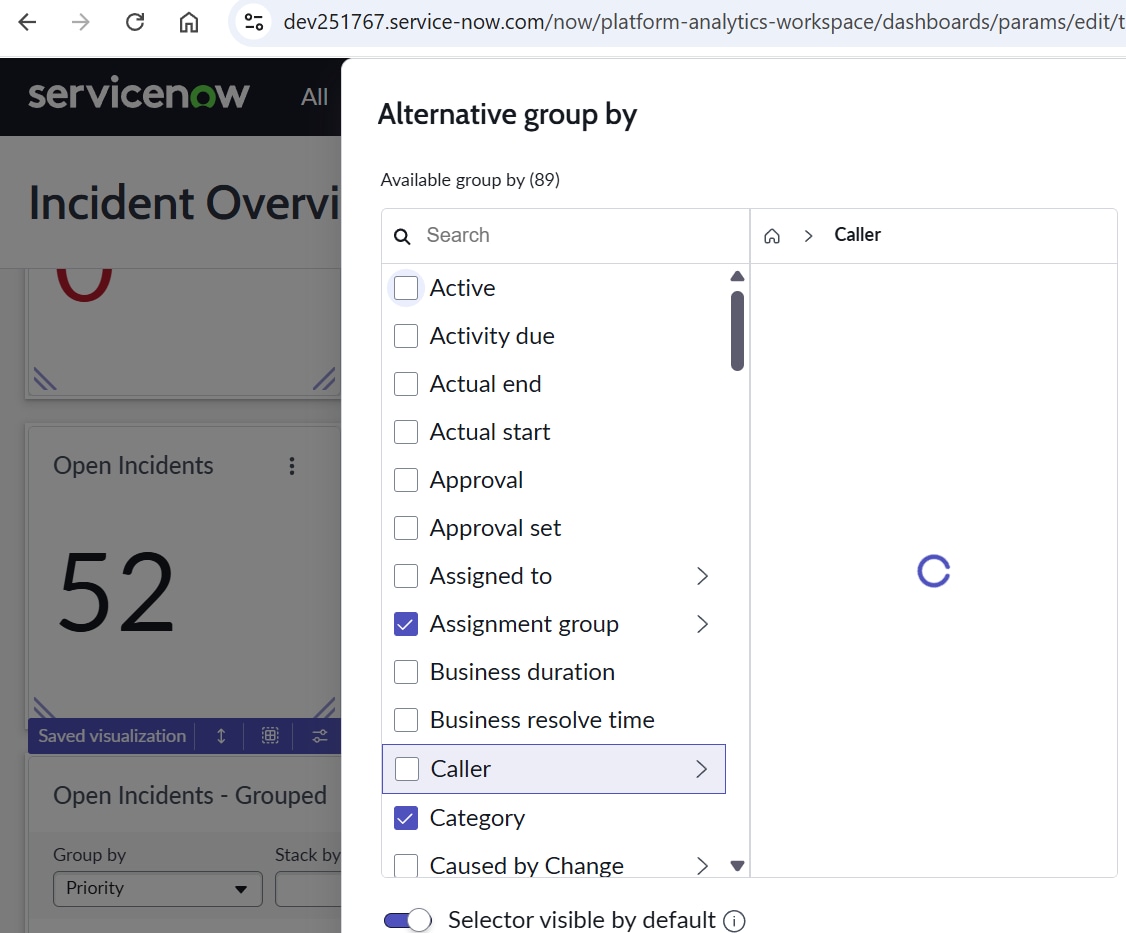
After upgrading to Australia release, I encountered a strange issue that was not in Yokohama regarding dot-walk technique on reports. For a data visualization, taking a simple list type for example, with data source using the Incident table, when trying to use "Group by" or "Add Alternative Group By", I got trapped in infinite loading when trying to dot-walk on fields with Reference type on the incident table. This also applies to adjusting columns & rows under Presentation. Given the context that these plugins has been all updated to latest versions but did not succeed to resolve:
+ @devsnc/sn-list-selector (sn_list-selector)
+ UI Builder (sn_ui_builder)
+ Data visualizations (sn_par_vis_base)
+ Platform Analytics (sn_app_analytics_w)
This issue seems to be affecting not only PDIs, but also production instances as well, so we reached out to Now Support and currently awaiting on their response. In the mean time, it would be helpful if I can get any advice about this. Attached example comes from a fresh PDI of latest Australia version.
Thank you everyone so much for your time!
Best regards,
Khang Nguyen (Kevin)
- Mark as New
- Bookmark
- Subscribe
- Mute
- Subscribe to RSS Feed
- Permalink
- Report Inappropriate Content
6 hours ago
Note: I just re-checked and this seems not affecting "Group by", but rather "Alternative group by" only.
Many thanks!