Trouble Sizing Report Widget on Dashboard; won't include the datatable
- Mark as New
- Bookmark
- Subscribe
- Mute
- Subscribe to RSS Feed
- Permalink
- Report Inappropriate Content
08-02-2023 01:01 PM
Hi, I feel like there's a simple way to do this, but I have no clue how.
I wanted to make a bar chart with a data table and put it on a Dashboard. Easy enough, make a bar chart report, choose my appropriate group by, and choose "Display data table" in the Configure tab on the report. The report itself looks exactly how I want it.
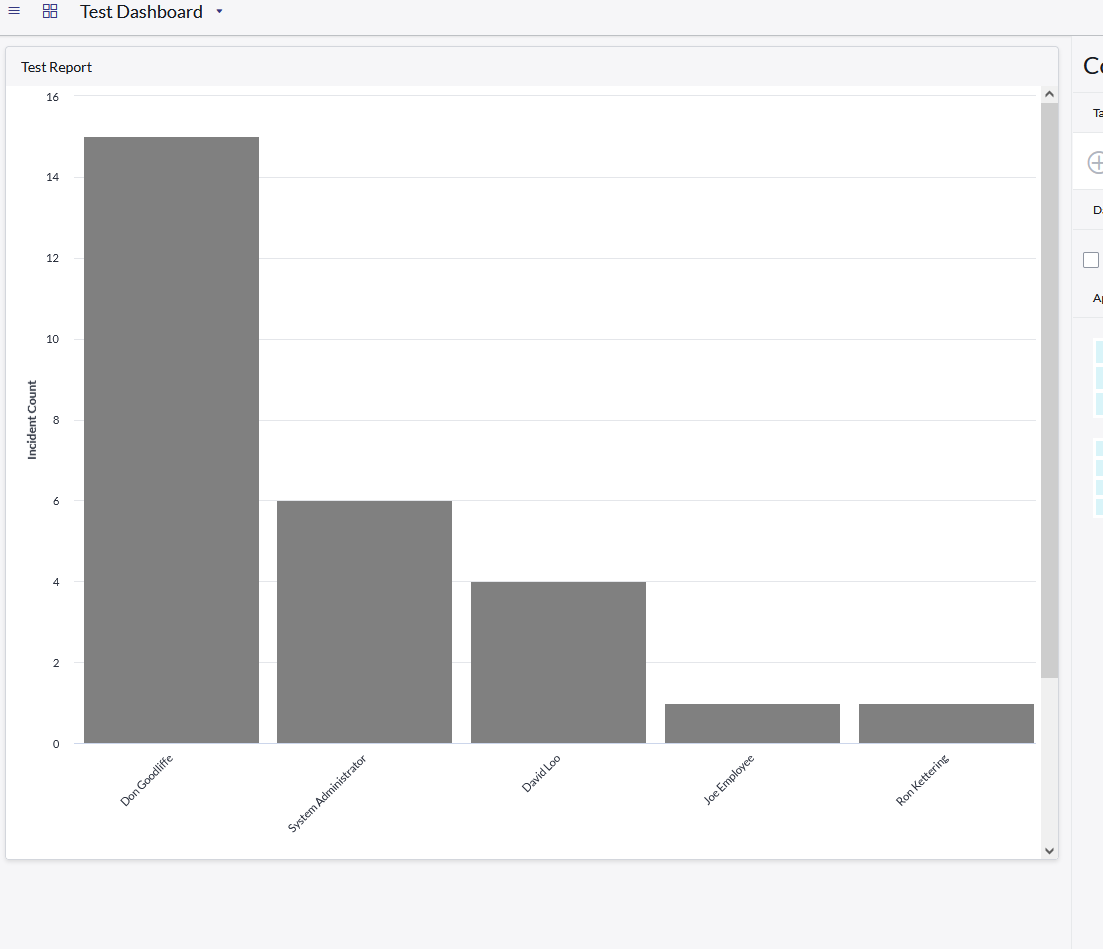
However, when I bring it onto my Dashboard as a Report Widget, for some reason it refuses to show the whole thing. No matter how I resize it, it will only ever show the bar chart (and I have to scroll down in the widget to see the data table). It's like the chart size has to equal the full widget size, with no room left over for the data table.
Is there a way to force my dashboard to show all of the report, not just the bar chart half? It's not the end of the world if not, but it's annoying that the table gets effectively hidden from my users. Open to any ideas here; hoping there's just something small that I've overlooked. 🙂
Here's some screenshots with an example off of a clean developer instance of SNOW to show what I mean
Thanks!
- Mark as New
- Bookmark
- Subscribe
- Mute
- Subscribe to RSS Feed
- Permalink
- Report Inappropriate Content
08-02-2023 11:03 PM
Hi @felix_h ,
No, not what I'm aware of. This is standard behavior from ServiceNow perspective.
if my answer has helped with your question, please mark my answer as accepted solution and give a thumb up.
Best regards
Anders
If my answer has helped with your question, please mark my answer as the accepted solution and give a thumbs up.
Best regards
Anders
Rising star 2024
MVP 2025
linkedIn: https://www.linkedin.com/in/andersskovbjerg/