- Mark as New
- Bookmark
- Subscribe
- Mute
- Subscribe to RSS Feed
- Permalink
- Report Inappropriate Content
07-24-2018 04:25 AM
Hi,
I used this line in my ui macro <g:evaluate var="jvar_guid" expression="gs.generateGUID(this);" />
I want to debug it and want to know which value will store in the variable var, Can anyone tell me how to debug UI Macros.
Thanks,
Solved! Go to Solution.
- Mark as New
- Bookmark
- Subscribe
- Mute
- Subscribe to RSS Feed
- Permalink
- Report Inappropriate Content
07-24-2018 10:02 AM
here you go.
what i had done now. i have created on ui macro and defined the one jvar into the break point to check the log.
UI Macro:

now the question is how did you invoke your ui macros, for me i just called it in my ui page
so for this i randomly created on ui page:
UI Page:

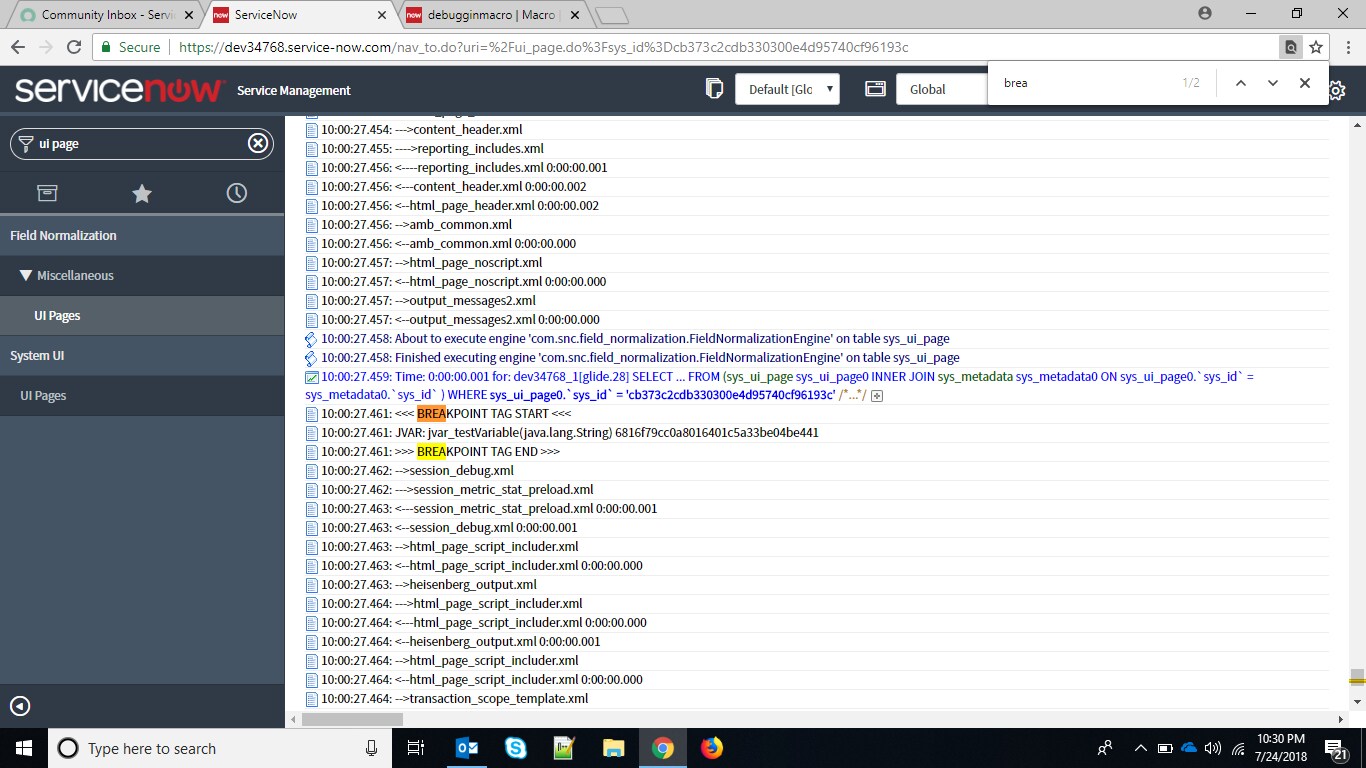
once you click on "Try It" on the ui page then scroll down and try to search "BreakPoint tag start". refer the screenshot below that i had searched and found.

Note: enable all the session debug.
hope it will help you now.
- Mark as New
- Bookmark
- Subscribe
- Mute
- Subscribe to RSS Feed
- Permalink
- Report Inappropriate Content
07-24-2018 04:31 AM
kindly refer the thread below and check @SNCSenpai comments
- Mark as New
- Bookmark
- Subscribe
- Mute
- Subscribe to RSS Feed
- Permalink
- Report Inappropriate Content
07-24-2018 04:33 AM
Hello
This link may helpful :
Using <g:breakpoint /> throws out a lot of variables, beyond the ones you are creating. Of course you can fine tune what variable you are looking for by writing it as <g:breakpoint var="[variable_name_comes_here" />. This can go anywhere in the UI Macro as long as it is after the variable declaration.
For example:
<j:set var="jvar_testVariable" value="${gs.hasRole('admin')}" />
<g:breakpoint var="jvar_testVariable" />
Mark Correct if this solves your issue and also hit Like and Helpful if you find my response worthy based on the impact.
Thanks
Sagar Tajane
- Mark as New
- Bookmark
- Subscribe
- Mute
- Subscribe to RSS Feed
- Permalink
- Report Inappropriate Content
07-24-2018 04:35 AM
I refered it previously and added <g:breakpoint var="jvar_testVariable" /> but i didn't understand below line.
To see the output you would, of course, need to enable Session Debug > Debug Log (or look at the logs, but I prefer session debug) and you will get output that looks something like this:
i didnt get any data after clicking on debug log.
- Mark as New
- Bookmark
- Subscribe
- Mute
- Subscribe to RSS Feed
- Permalink
- Report Inappropriate Content
07-24-2018 04:42 AM
