Month Wise Incident Counts (Table View)
- Mark as New
- Bookmark
- Subscribe
- Mute
- Subscribe to RSS Feed
- Permalink
- Report Inappropriate Content
12-25-2022 06:23 PM
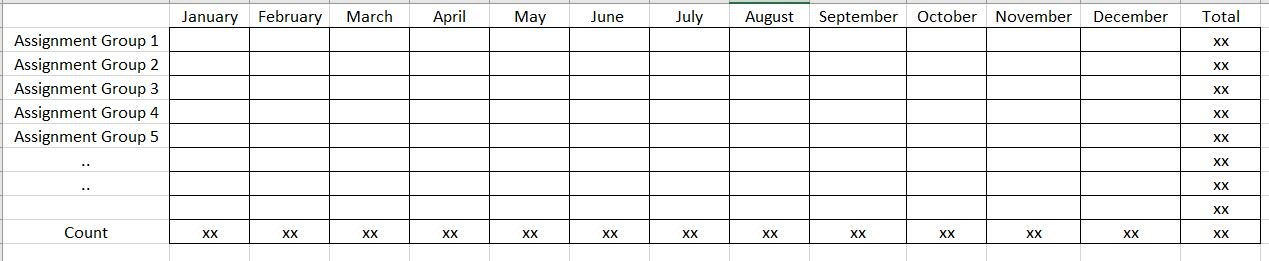
I want to generate a report containing monthly counts of incidents handled by a set of assignment groups. (Please refer to the attachment)
Tried to generate this using pivot table option in reporting module, but month wise breakdown is not appearing. Any suggestions to achieve this.
- Mark as New
- Bookmark
- Subscribe
- Mute
- Subscribe to RSS Feed
- Permalink
- Report Inappropriate Content
12-25-2022 09:46 PM - edited 12-25-2022 10:12 PM
Hi,
You can create a time series report (e.g Column report) and add Trend by as "Created" per "Month" and add "Assignment Group" as Group by.
Note that if you run the report on incident table, it will only give show incidents handled by the last assignment group. To understand the number of incidents handled by a group even though it may have been transferred to another group, explore incident_metric.
Thanks,
Arav
- Mark as New
- Bookmark
- Subscribe
- Mute
- Subscribe to RSS Feed
- Permalink
- Report Inappropriate Content
01-04-2023 10:32 AM
Thanks Arav, but my requirement is to have a tabular view as per the attachment.
- Mark as New
- Bookmark
- Subscribe
- Mute
- Subscribe to RSS Feed
- Permalink
- Report Inappropriate Content
08-12-2024 01:48 PM
Did you ever figure this out? I have a very similar requirement.
- Mark as New
- Bookmark
- Subscribe
- Mute
- Subscribe to RSS Feed
- Permalink
- Report Inappropriate Content
02-19-2025 08:42 AM
Even i do have similar requirement. Please let me know if you have figured this out.