How can I get disk usage metrics using Agent Client Collect?
- Mark as New
- Bookmark
- Subscribe
- Mute
- Subscribe to RSS Feed
- Permalink
- Report Inappropriate Content
02-18-2022 12:26 PM
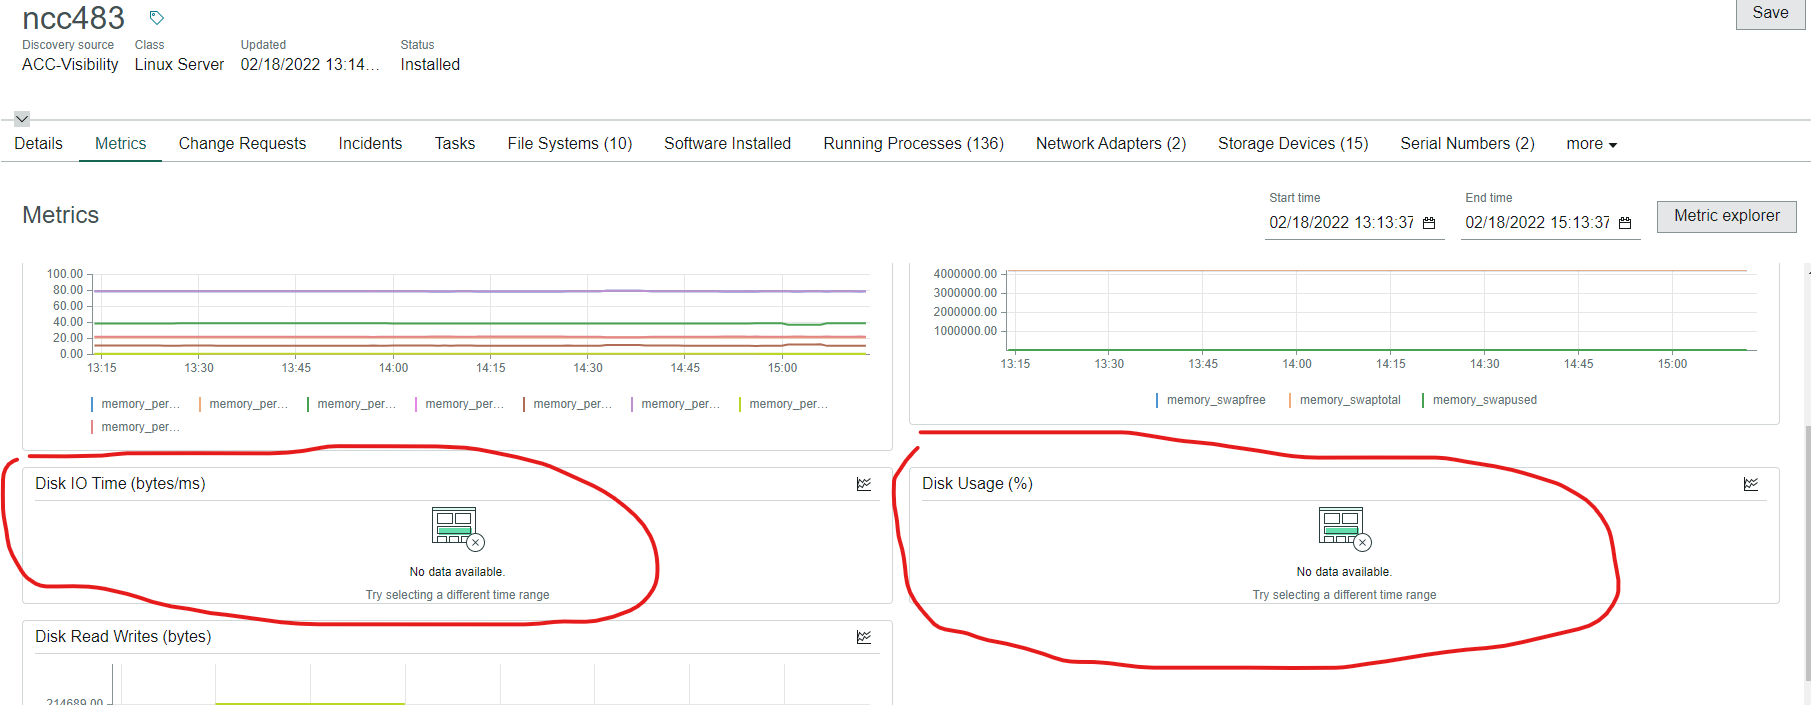
I'm trying to get disk usage metrics and alert on low available space. I have installed ACC on a linux host. I can see CPU statistics but no disk usage percentage metrics. Anyone know why that could be? I'm also having trouble with http proxy url monitor, too. I can get alerts on url timeout, but no metrics for response check.
Thanks for any pointers.
Rick
Here's some screenshots of what I mean:


- Mark as New
- Bookmark
- Subscribe
- Mute
- Subscribe to RSS Feed
- Permalink
- Report Inappropriate Content
02-18-2022 01:03 PM
Hi Rick,
Right now, alerting on metrics requires you to configure and deploy event service checks; while capturing metrics requires you to configure and deploy metric service checks. This can be confusing.
The metrics checks require very little set up but you do have to enable them.
To get events, you need to enable the Linux OS Events policy and make sure that it is linked to your agent. Make sure that you have enabled these checks:
- os.linux.check-disk-iotime: his check measures the disk ioTime against thresholds and filters, returns CRITICAL\WARNING\OK according to the thresholds given in the parameters
- os.linux.check-system-disk-usage: This check measures the disk usage against thresholds and filters, returns CRITICAL\WARNING\OK according to the thresholds given in the parameters
To get metrics, you need to make sure that the os.linux.metrics-system-disk-capacity service check is enabled in the Linux OS Metrics policy. You might double check because there are several different service checks that seem to overlap (at least in names)
- os.linux.metrics-system-disk: Collects the following metrics about the disk: reads, readsMerged, sectorsRead, readTime, writes, writesMerged, sectorsWritten, writeTime, ioInProgress, ioTime, ioTimeWeighted
- os.linux.metrics-system-disk-capacity: Collects the following metrics about the disk capacity used
- os.linux.metrics-system-disk-usage: Collects the following metrics about the disk usage: total, used, avail, used_percentage
For URL monitoring, there are some different checks to enable:
- util.metrics-http-curl (to get the response time metrics)
- util.check-http-response OR util.check-http-follow-redirect (to get up/down)
Some "is it plugged in?" things (please don't take offense):
- Make sure that the service checks are included in a policy
- Make sure that the policies are active
- Make sure that the policies do not have unpublished changes
- Make sure that the agent in question is linked to the policies you think it should be running
One way to check is to go to your agent list, then drill into the agent and look at the related list that shows the checks that are running.
Another thing you can do is to test each service check instance (linked to a policy) against the agent in question.
Good luck!
Greg Hubbard
- Mark as New
- Bookmark
- Subscribe
- Mute
- Subscribe to RSS Feed
- Permalink
- Report Inappropriate Content
02-18-2022 01:52 PM
Hi Greg,
Thanks for the reply. I've enabled these policies - marked red.

At the bottom of the policy, checks appear to be active from what I see.

I can tail the acc.log on my server with the agent and see it has disk stats :

Any idea what else I might check? I appreciate your advice.
Rick.
- Mark as New
- Bookmark
- Subscribe
- Mute
- Subscribe to RSS Feed
- Permalink
- Report Inappropriate Content
02-18-2022 02:20 PM

- Mark as New
- Bookmark
- Subscribe
- Mute
- Subscribe to RSS Feed
- Permalink
- Report Inappropriate Content
02-21-2022 04:19 AM
Hi Rick,
I'm happy that you are able to get the HTTP metrics now.
Thanks
As for the disk metrics, I'll ask one of our engineers to respond.
Thanks
Nir