- Mark as New
- Bookmark
- Subscribe
- Mute
- Subscribe to RSS Feed
- Permalink
- Report Inappropriate Content
03-23-2012 08:06 AM
Bear with me, I'm pretty new to SN and very new to scripting. I'm pretty good at reverse engineering things but not as great at creating from scratch. After searching the forums I noticed that there didn't seem to be a way to get an aging report for incidents. (How many open are 0-2 days old, 3-7 days old, etc.)
Below is what I have tried and it's not quite working yet, anyone wanna point out where I screwed up?
I created a new field called Aging Category (u_aging_category) on the incident table.
I wrote the following script as a scheduled job:
//************************ Set Aging Category **************************************
var optime = current.opened_at.getGlideObject().getNumericValue();
var nowtime = gs.nowDateTime().getGlideObject().getNumericValue();
var totalTime = nowtime - optime ;
var calculation = totalTime/1000/60/60/24;
if (calculation <= 2){
current.u_aging_category = '0-2 Days';
}
if (calculation <= 7 && calculation > 2){
current.u_aging_category = '3-7 Days';
}
if (calculation <= 14 && calculation > 7){
current.u_aging_category = '8-14 Days';
}
if (calculation <= 21 && calculation > 14){
current.u_aging_category = '15-21 Days';
}
if (calculation <= 28 && calculation > 21){
current.u_aging_category = '22-28 Days';
}
if (calculation > 28){
current.u_aging_category = '> 28 Days';
}
In theory this should update the Aging Category field when I run the job and then I can report on it using a Pivot table. Unfortunately, the field is not updating. Any quick thoughts?
Solved! Go to Solution.
- Labels:
-
Service Mapping
- Mark as New
- Bookmark
- Subscribe
- Mute
- Subscribe to RSS Feed
- Permalink
- Report Inappropriate Content
03-24-2012 02:13 PM
I believe the problem is you are not actually querying any records, nor updating them. This is what I have done.
I have a Scheduled Job...
...that calls a function in a Script Include:

function u_updateAgingCategoryField() {
  var elapsedTime = 0;
  var aging = '';
  var currentTimeNow = gs.nowDateTime();
  var gr = new GlideRecord('incident');
  gr.addEncodedQuery('u_aging_category!=>28^ORu_aging_category=');
  gr.query();
  while(gr.next()) {
    elapsedTime = (gs.dateDiff(gr.opened_at, currentTimeNow, true)) /60/60/24;

    //check to see when the item was created
    if (elapsedTime <= 2) aging = '0_2';
    if (elapsedTime > 2)  aging = '3_7';
    if (elapsedTime > 7)  aging = '8_14';
    if (elapsedTime > 14) aging = '15_21';
    if (elapsedTime > 21) aging = '22_28';
    if (elapsedTime > 28) aging = '>28';

    gr.setWorkflow(false);    //skip any Business Rules
    gr.autoSysFields(false);  //do not update system fields
    gr.u_aging_category = aging;
    gr.update();
  }
}
Notice in the function that I am excluding incidents >28 days because we do not want to keep updating them with ">28 Days" all the time.
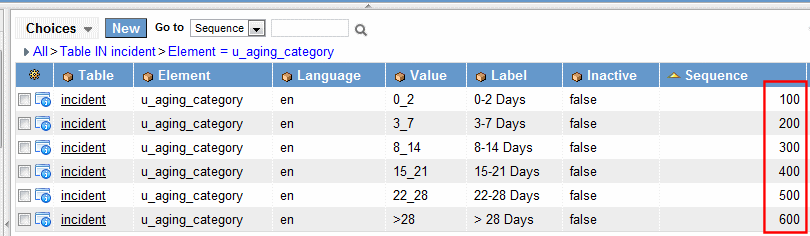
Now for the trick so that the Pivot Table orders the columns properly - on the Aging Category dictionary record, set the Default value to be "0_2" and the Choice field to "Dropdown without -- None --" and create some Choice entries:

Otherwise the report will sort the columns alphabetically. And so you should end up with the following report:

It is setup in https://demo23.service-now.com/ at the moment. I've also attached an update set that will re-create it for you if you do not get a change to look at demo23 today.
- Mark as New
- Bookmark
- Subscribe
- Mute
- Subscribe to RSS Feed
- Permalink
- Report Inappropriate Content
03-23-2012 04:21 PM
Why not create a report on the incident table. Use horizontal bar graph as type and then choose group by as created (or updated if you want to see stagnating). Thats a simpler way to go IMHO.
- Mark as New
- Bookmark
- Subscribe
- Mute
- Subscribe to RSS Feed
- Permalink
- Report Inappropriate Content
10-12-2016 07:48 AM
Excellent work around without necessity of a scrip
- Mark as New
- Bookmark
- Subscribe
- Mute
- Subscribe to RSS Feed
- Permalink
- Report Inappropriate Content
03-23-2012 07:12 PM
That works great for overall and I'll use it a bunch. The problem is, my boss wants a report like a pivot table where the rows are the assigned groups (assigned_to) and the columns are the aging category thus being able to easily see who has how many incidents of each aging category.
- Mark as New
- Bookmark
- Subscribe
- Mute
- Subscribe to RSS Feed
- Permalink
- Report Inappropriate Content
05-21-2015 12:19 PM
Conan Lloyd My company is currently using a report like that.

Is this what you are looking for? each color represents a group.