


Anne Barnes1

ServiceNow Employee
Options
- Subscribe to RSS Feed
- Mark as New
- Mark as Read
- Bookmark
- Subscribe
- Printer Friendly Page
- Report Inappropriate Content
02-07-2018
10:37 AM
ServiceNow rings in a new era of innovation and creativity in Kingston IT Service Management. In this blog we will deep dive into Benchmarks features.
What is the big deal about Benchmarks?
Let's take a hypothetical example. Assume you close high priority incidents in 8 hours on average. You're happy — over the last year, you've brought that down from 10 hours. But, is it good enough? What if you knew that other similar organizations did it in half the time? It's a completely different picture. You may have improved — but you're still 4 hours behind. And, that 4 hours is hurting your business. — whether that's measured in lost productivity, lost revenues, or poor customer satisfaction.
With Benchmarks, you know exactly how you are doing compared to your peers. You can use Recommendations to make improvements to streamline and strengthen your processes to become a leader.
Advantages of Using Benchmarks in Kingston
With Jakarta, Benchmarks are available through your production instance instead of solely through the HI portal. Kingston brings you many new features:
- New KPIs
- Filter by Geography
- Configure your KPI Definitions
- Quick Trend View
- Expanded KPI View
- Recommendations
New KPIs
Seven new KPIs are available in Kingston bringing the total number of available KPIs to 23 (20 ITSM and 3 ITOM). (For detailed information about the available KPIs and data information, see the product documentation topic Benchmark KPIs.)
Filter by Geography
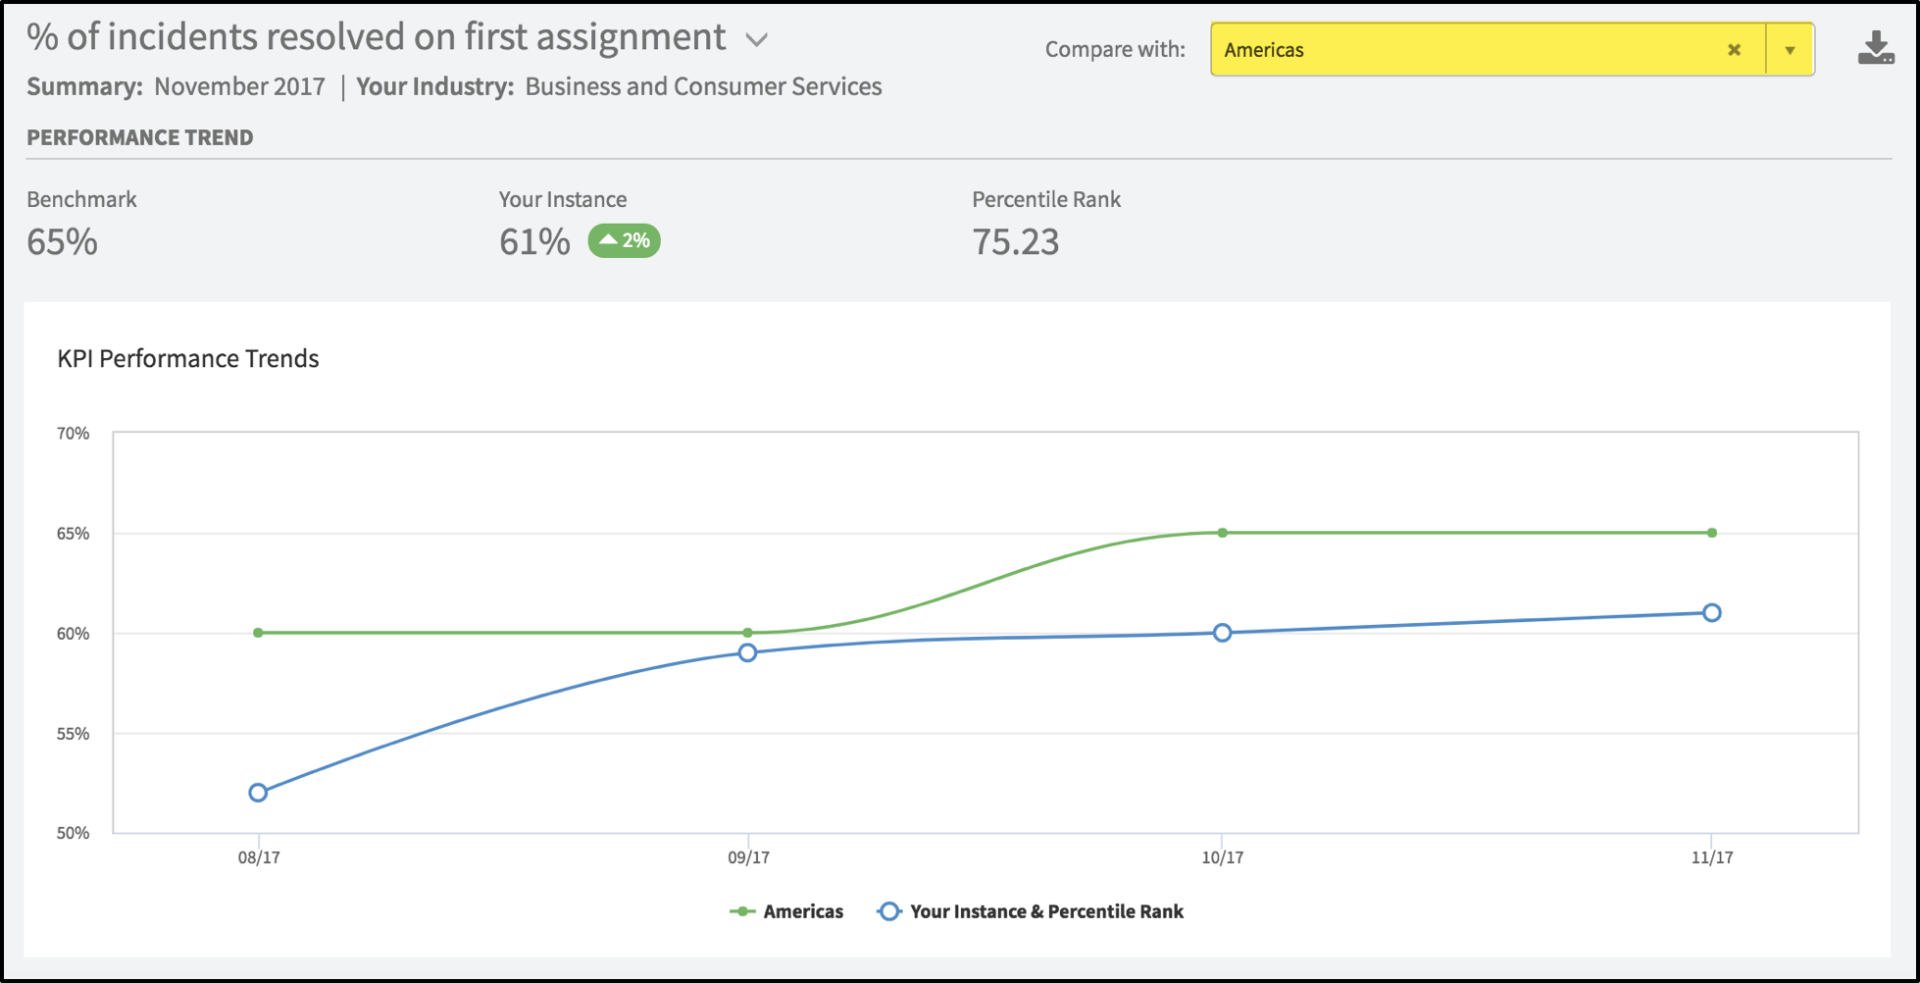
In addition to the current ability to filter your peers by Industry and Number of Users, we have added the ability to filter by Geography. Different geographical areas may have regional and cultural factors at play. Comparing against the peers in your geographical area may allow you better insights in some cases. Look at the images below to see the differences between regions for the % of incidents resolved on first assignment KPI.
Americas
EMEA
Asia Pacific
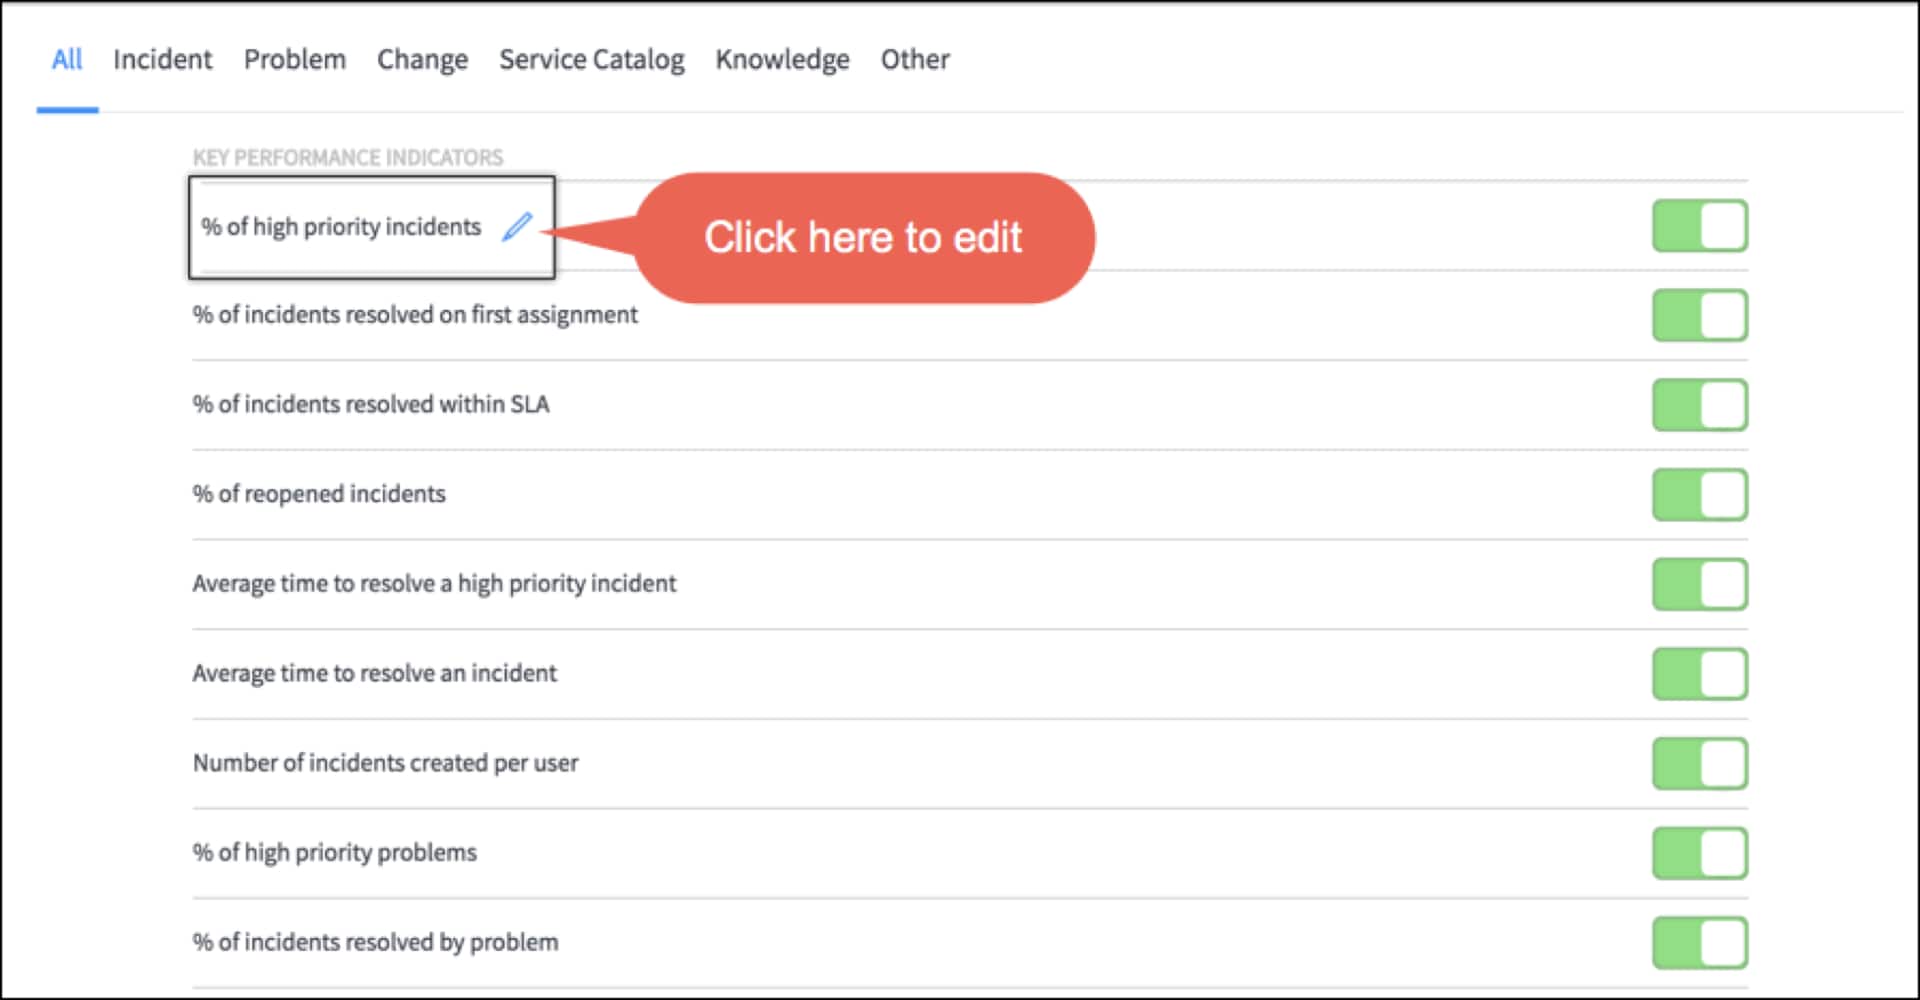
Configure Your KPI Definitions
You may have a different definition for your KPI than your peers. For example, the definition for % of High Priority Incidents is: the number of P0 and P1 incidents resolved in a month / the total number of incidents resolved in the same month.
This definition is accurate for the majority of our ServiceNow customers. But perhaps your definition of a High Priority Incident is different. It is easy to go in and adjust your KPI definitions. Here is how to do this:
- On the Benchmarks Setup page, click on the benchmark you wish to edit, or hover on the benchmark and click on the pencil to edit.
- In your KPI definition screen, expand the Definition section. Then change the criteria for your organization. In this example, we have changed the criteria for our High Priority Incidents to anything that is a P0, P1, or P2.
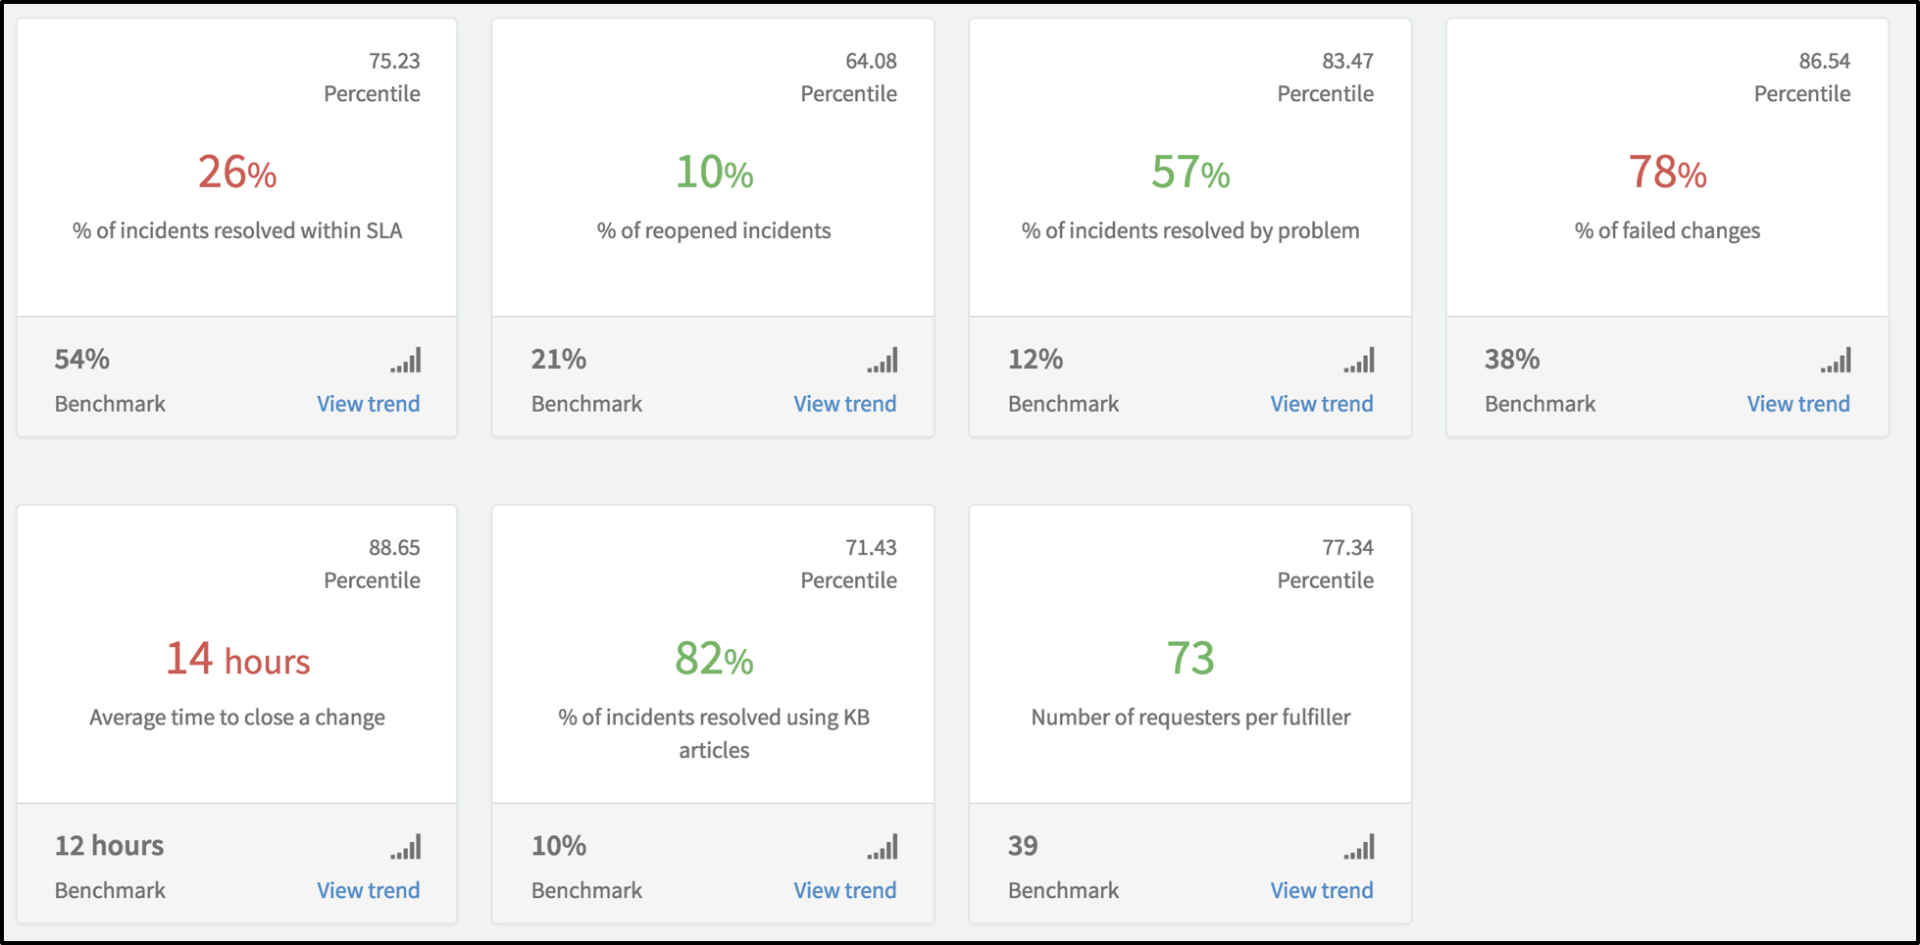
Quick Trend View
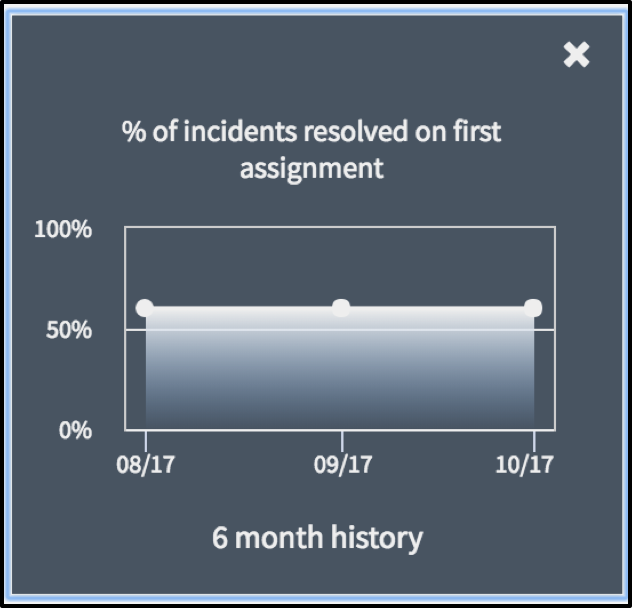
It is terrific to be able to see where you are at with your KPI this month, but are you improving or doing worse? You can quickly and easily view a six month trending view of any of your benchmarks from the Benchmarks Dashboard.
On any benchmarks card, click on View Trend. The card will flip and show your six months trend. To go back to your KPI, simply close the trend chart.
Expanded KPI View
The quick trend view is very helpful to quickly see how you are doing on KPIs, but there is more detailed information available. Simply click on the KPI card, and you will be taken to this screen:
- The KPI value for your peer group.
- Your KPI value.
- The change in your KPI from the previous month. Green indicates an improvement and red indicates a decline in your KPI.
- Your percentile ranking compared to your peers.
- A six-month trending chart comparing your KPI against that of your peers.
- And if you would like a report of your KPIs for the month, simply click on this icon and you can download a PDF version of the report.
Recommendations
Now that you know what your KPI value is, how you compare to your peers, and how your KPI has trended over six months, where do you start to improve your KPI? Benchmarks in Jakarta now has a Recommendation list for each KPI. This list is located under the KPI Performance Trends chart in the image above.
Recommendations are ranked in importance for each customer, and may vary depending upon what you have implemented in your instance.
- To start a Continual Service Improvement initiative for a suggestion, you can click on the Get Started button. This will take you to either a Guided Setup to walk you through the implementation, or documentation to assist you with this improvement project.
- Once you have implemented the suggestion, click on Mark as Implemented. This will place a mark on the graph to show when you have implemented various initiatives, allowing you to track your progress after the implementation.
- Finally, you can Save for Later if you do not wish to implement the recommendation at this time.
Here is an example of an implementation of a recommendation.
Summary
ServiceNow Benchmarks are a powerful tool allowing you to analyze and improve your performance, improving your bottom-line and market performance.
Benchmarks Resources
For more information about Benchmarks in Kingston, check out these resources:
- Benchmarks overview product documentation topic
- Benchmarks troubleshooting product documentation topic
- Benchmarks performance trends and recommendations product documentation topic
- Benchmarks in Jakarta
- How Does Your Performance Compare With Your Peers
- Benchmarks FAQ
Labels:
You must be a registered user to add a comment. If you've already registered, sign in. Otherwise, register and sign in.
